By: Doug Rosen
I start my analysis on this pair looking at the EUR/CHF. As always, I want to determine relative strength. On the weekly chart the EUR/CHF looks bullish base on ema's. The weekly 5 has crossed above the 21 but the stochastics is in the overbought zone. In the daily we have reached a trend line overlapped with a 233 ema and the 5 ema appears to be rolling over. It is still a tough read with the EUR/CHF since there is mixed signals but if the daily 233 ema holds up price may fall and this should weaken the EUR a bit. The GBP/CHF looks very similar to the EUR/CHF on the weekly chart, the weekly 5 ema is crossing above the 21 ema, however, on the daily price has wicked above the 233 ema a few times and we are riding the 5 ema up and it looks as though the 5 ema could push price through the 233 which could add to GBP strength. For the most part the GBP appears to be stronger than the CHF on all time frames. Now, looking at the EUR/GBP starting with the weekly prices has been pushed down by the weekly 13 and 21 ema's. On the daily, the 5 has crossed below the 233, 21 and 13 ema's and the stochastics is crossing down. Price has just fallen below the monthly S1 Pivot Point and is below the weekly M2 as well as the daily central pivot point, all very bearish indications. Price is trying to ride the 4 hour 5 ema down and has not broken the 4 hour 13 ema.
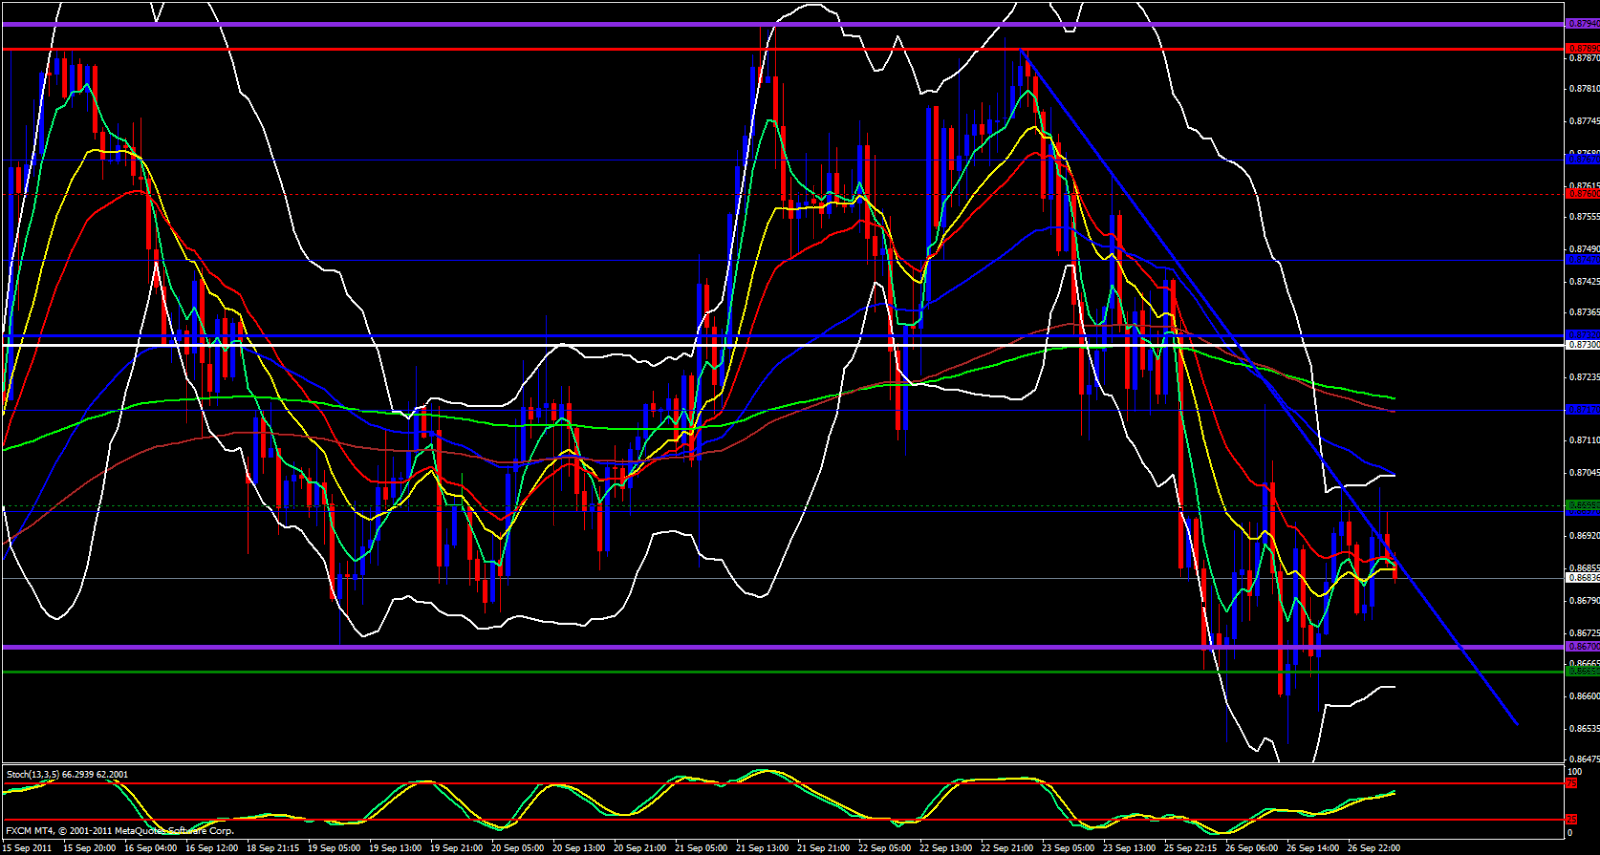
On the 1 hour chart it appears we are bouncing down from a descending trend line.
Finally, on the 15 minute chart the 5 ema is crossing below the 21, 13 and 55 ema's and price recently bounced off the daily central pivot point which overlapped with the 144 ema, upper Bollinger Band and the 50.0 fib of yesterday's range. Technically the EUR/GBP appears bearish and the GBP is obviously on the strong side and the EUR appears to be a bit weak. We will keep this in consideration when analyzing the EUR/USD and GBP/USD.


