By: Doug Rosen
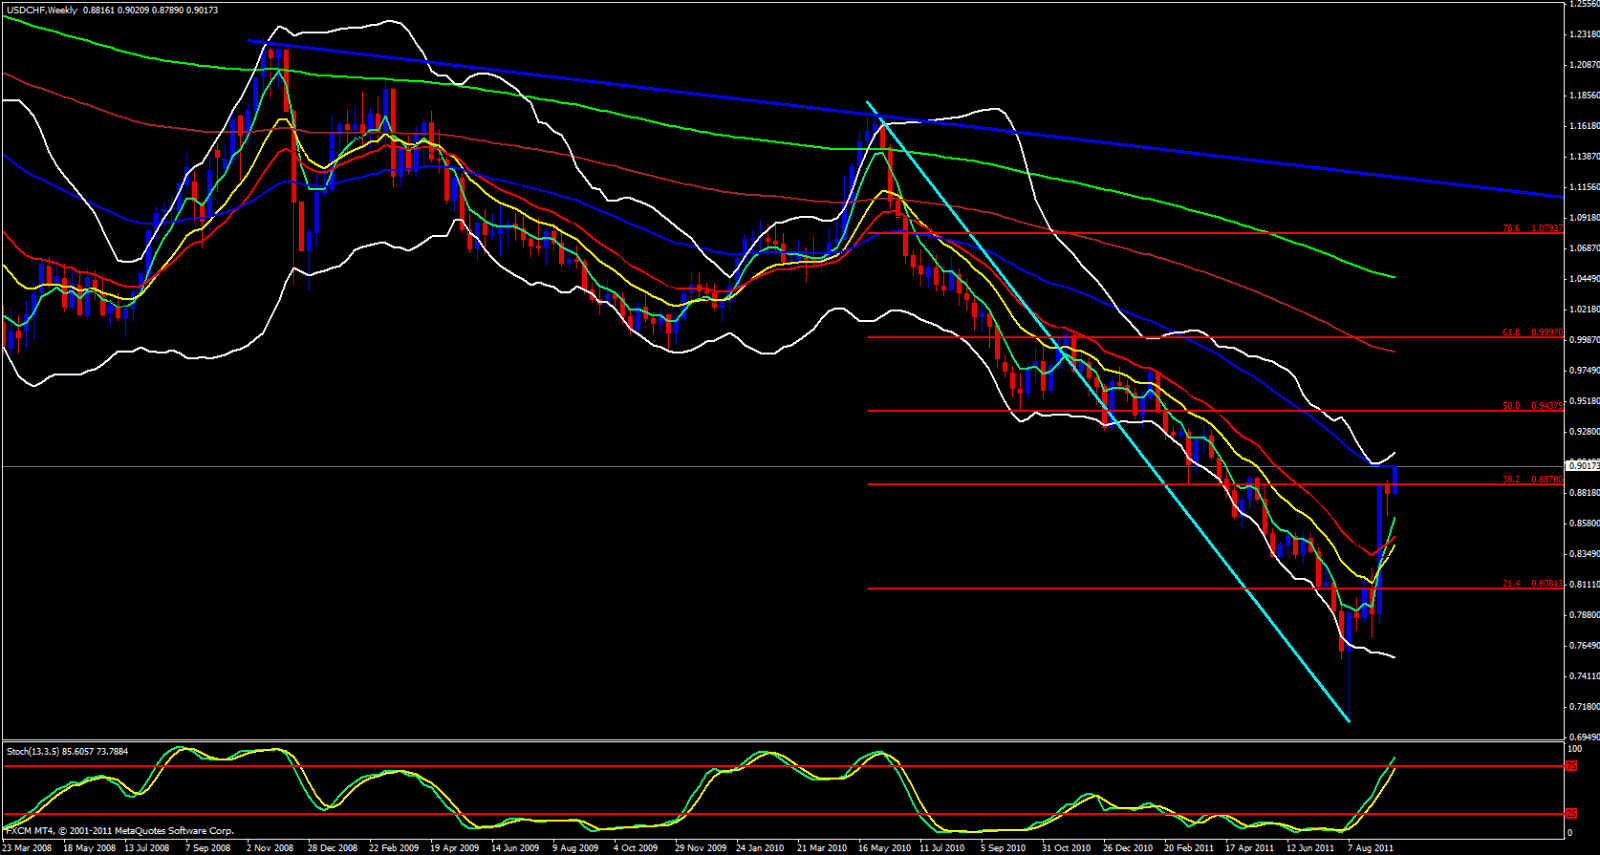
USD/CHF pair has been extremely bullishh but finds itself just above the 38.2 fib of its most recent drop and up against the weekly 55 ema with a Stochastics in the overbought zone.
The upper Bollinger band is open and pointing up, presenting a bullish attitude. Regardless of how bullish this pair is we still cannot ignore the fact that we have reached an area where a pullback would be quite logical. The weekly ema's are at a small distance from current price action with a 5 pointing straight up, yet I feel that price needs to make contact with the 5 ema before it continues upward.

Looking at the daily, as with he weekly it looks very bullish with a bullish Bollinger Band open and pointing up and price is riding the 5 ema and the 13 is crossing the 233 and tagging along with the 5 ema which further indicates bullish conditions but the daily candle is still gapped away from the 5 ema and the stochastics is in the overbought zone.

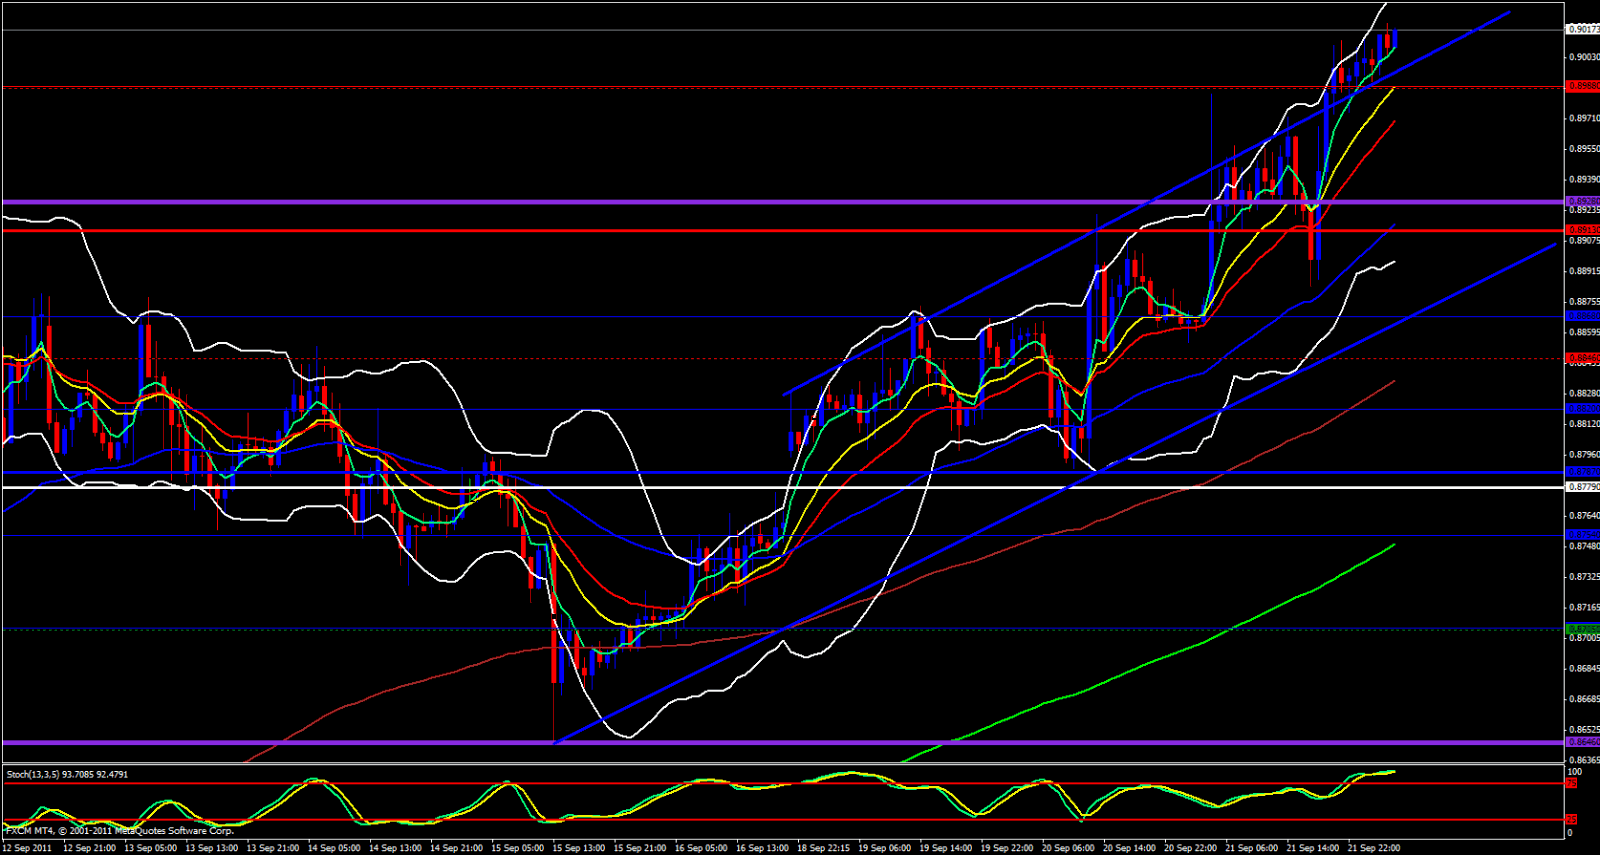
Taking a quick look at Pivot Points I see that the monthly R2 has been broken as well as the weekly M4. We are already above yesterdays high. Looking at the 4 hour chart I see that we are riding the 5 ema with the upper Bollinger Band open and pointing up. 4 Hour Stochastics is in the overbought zone as well.

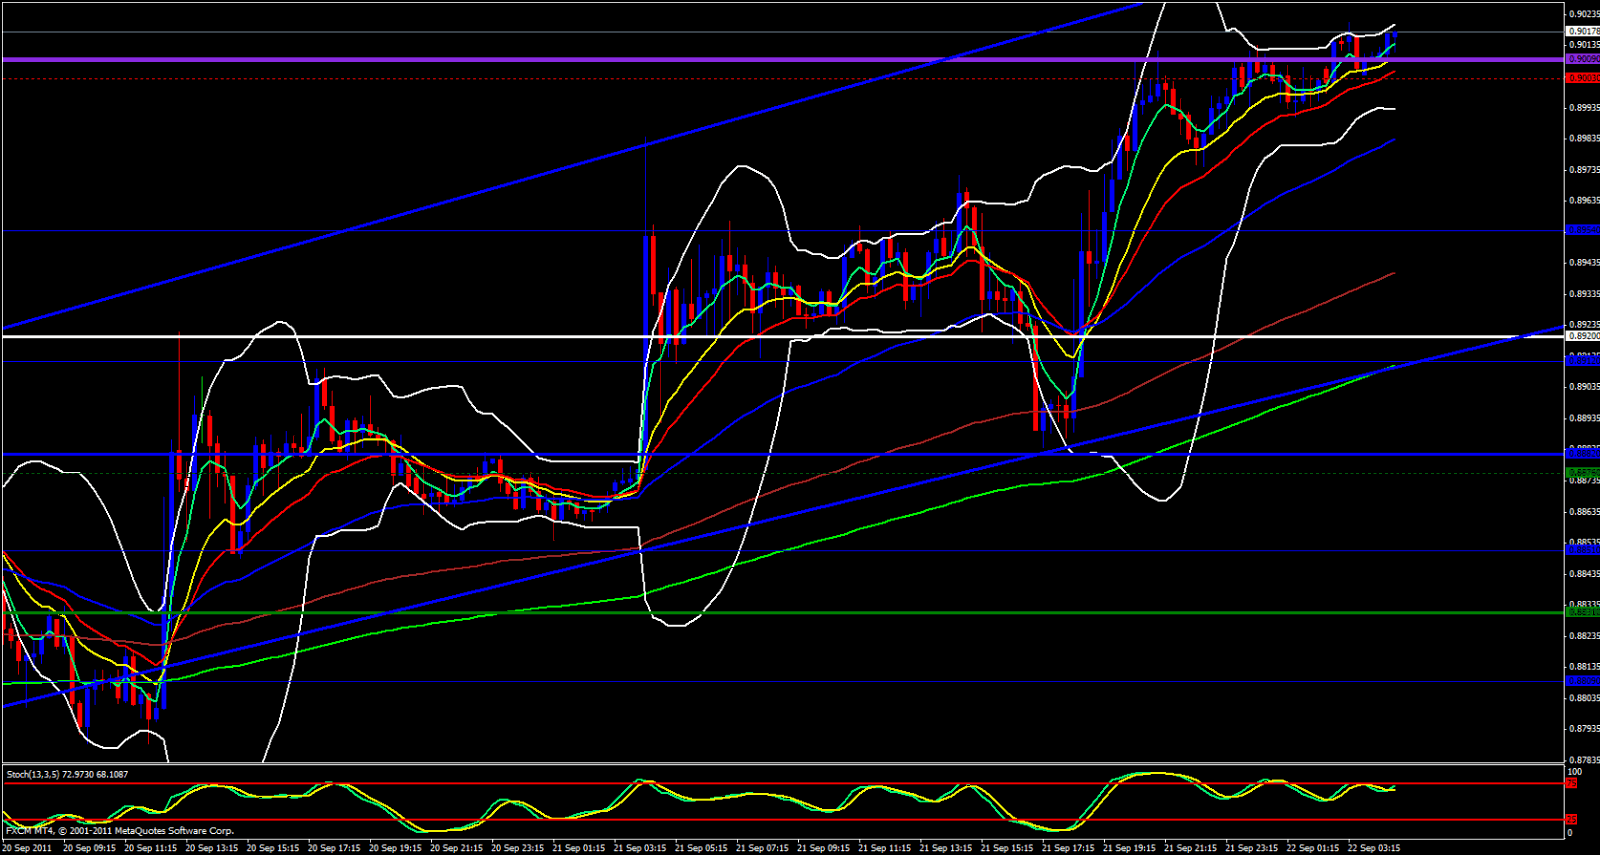
Same story with the hourly chart, riding the 5 wide angle and separation of the ema's and an hourly Stochastics in the overbought zone. 15 Minute chart looks just as bullish as the others. There is no reason to think that this pair will slow down from its bullish trend upward and it does not have to slow down or pullback, however, as bullish as it is we cannot ignore that we are in a pullback zone and price is just as likely to suddenly tank as it is likely to keep going.

