By: Colin Jessup
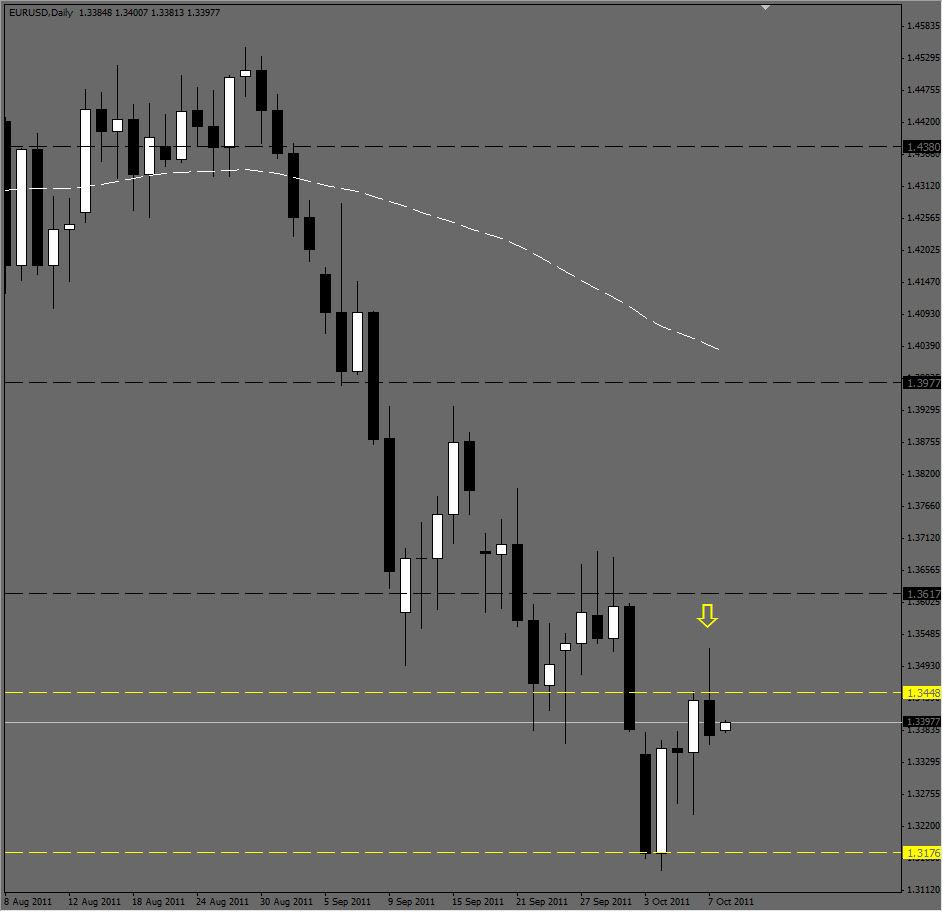
Trading closed last week with a really nice bearish inverted hammer on the EUR/USD pair daily chart. The candle formed at the resistance zone of 1.3450 pushing at high as 1.3524 and then closing about 75 pips lower at 1.3375, well below the resistance zone and Moving Average. However, the monthly candle is almost exactly the same but with a bullish sentiment. We are at a critical level as I mentioned last week, and could soon resume a bullish tone. That said, price can still fall and might be looking to form a daily double bottom at 1.3175 before turning bullish. If we break below 1.3360, look for support at 1.3275 and then 1.3175, which is where I expect the bounce to occur, if it forms at all. On the bullish side, if price breaks above 1.3450 look for further resistance at 1.3475 and 1.3600 will be the next major resistance zone.
Happy Trading!


