By: Doug Rosen
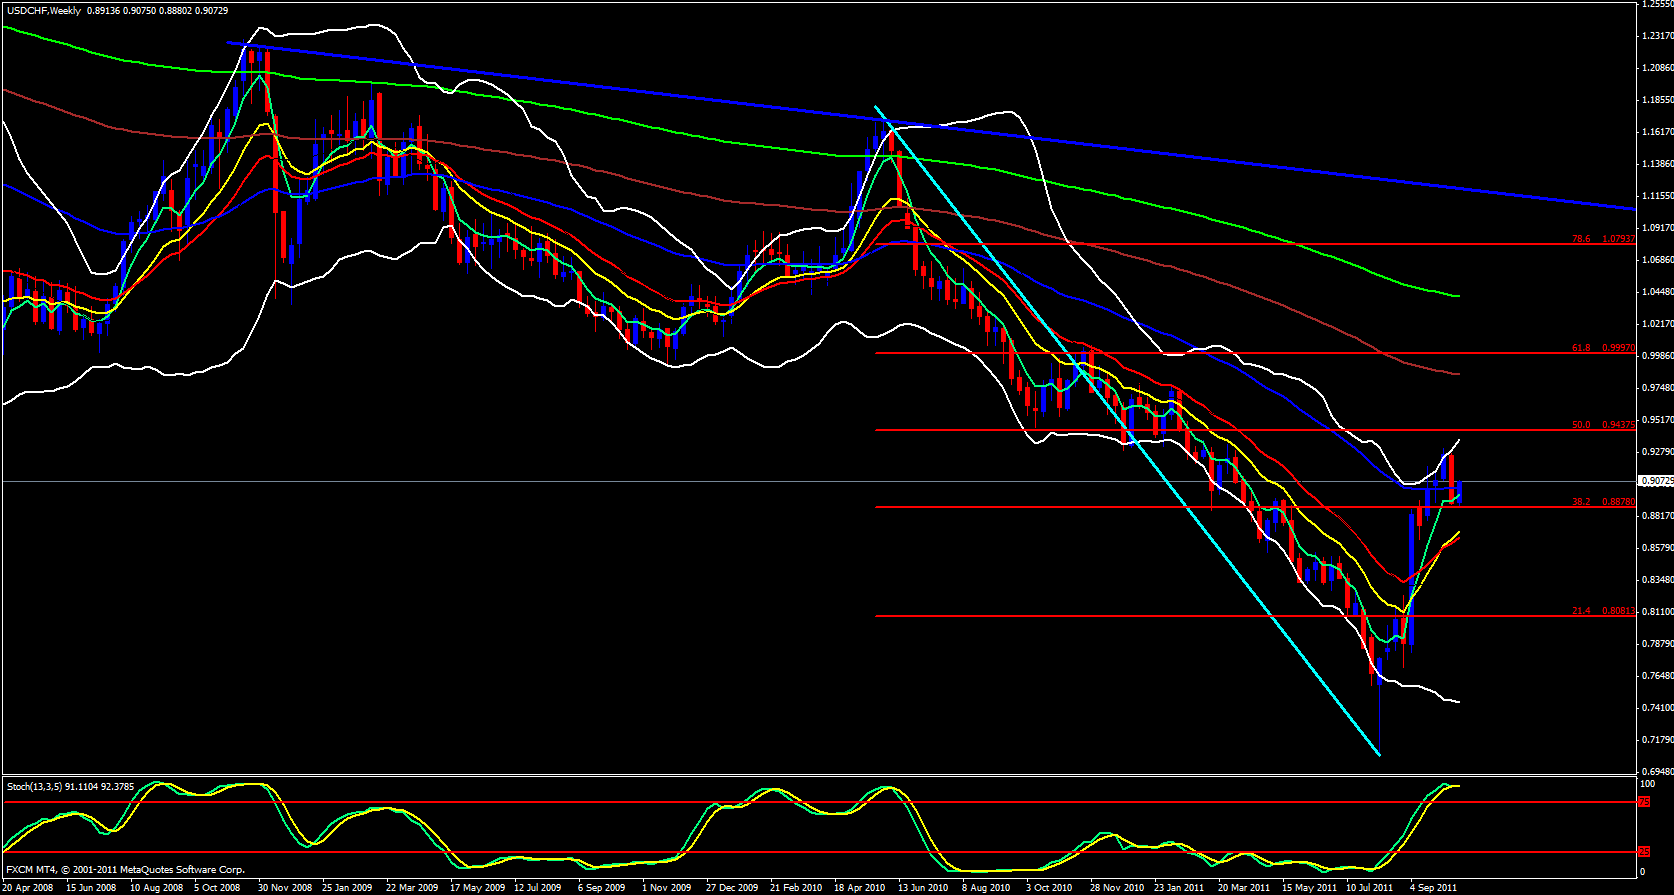
Looking at the weekly chart it appears we are heading back up. Last week we dropped from nearly the 50.0 Fib level back down to the 38.2 and now we are back on the rise.
Price is riding ht e5 ema up and the upper Bollinger band is open and pointing up, I believe price will continue to rise to the 50.0 Fib or even beyond.
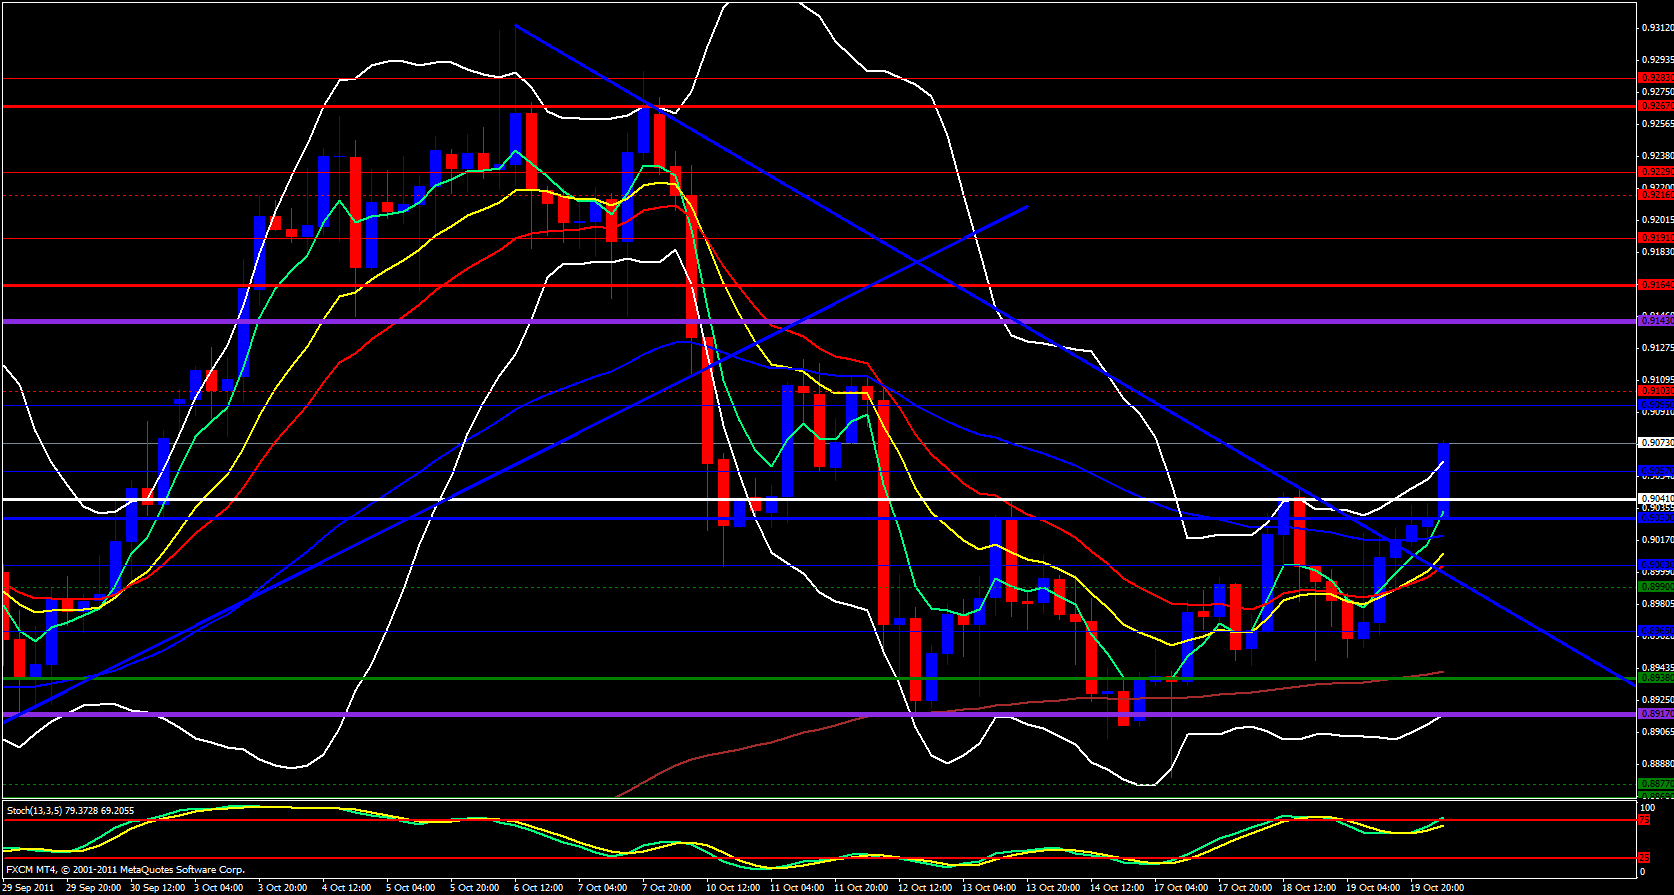
On the daily chart we are bouncing off a support trend line and the 5 ema is giving the daily candle a lift and crossing above the 13 ema and the stochastic is in the oversold zone.
Moving over to the 4 hour chart it is clear price is riding the 5 ema and price has already broken above the monthly central pivot point I expect price to keep on going, but a retracement will soon occur giving the rst of us an opportunity to join the party.
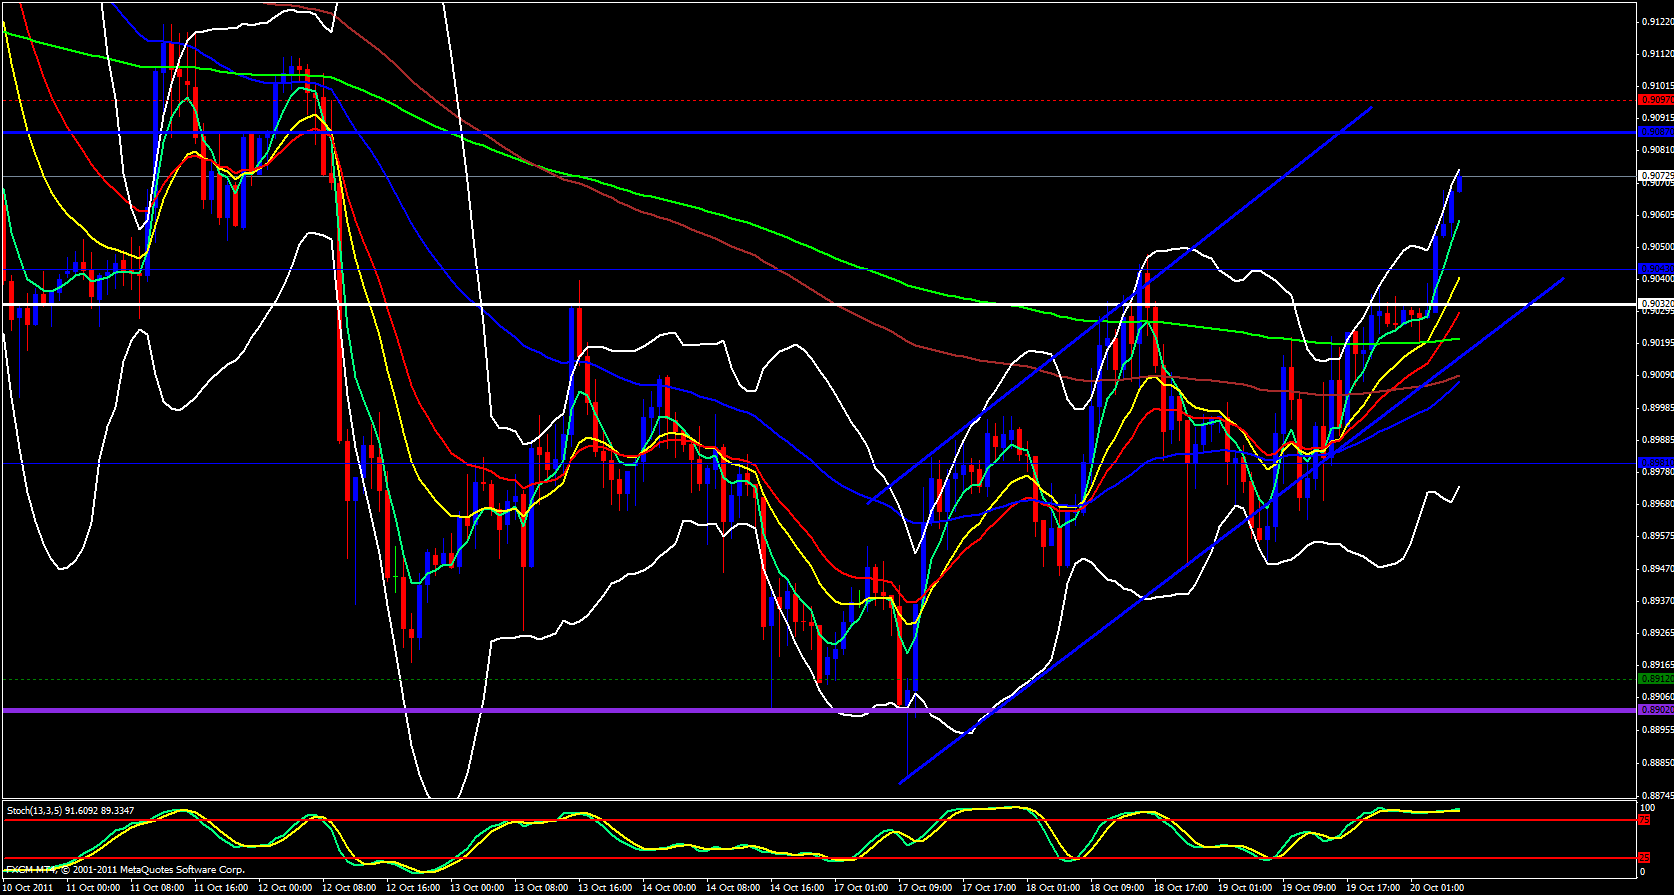
Moving on tot he hourly chart the upper Bollinger band is open and pointing up and price is riding the 5 ema. The weekly M3 is at 0.9097 so it is there I would expect price to stop and retrace back down to the 5 ema giving an opportunity to find an entry.
On the 15 minute chart price is reaching the daily M4 and the stochastic is in the overbought zone so we should soon see price fall a bit, maybe down to 0.9058 then should continue on up.


