By: Fadi Steitie
Weekly:
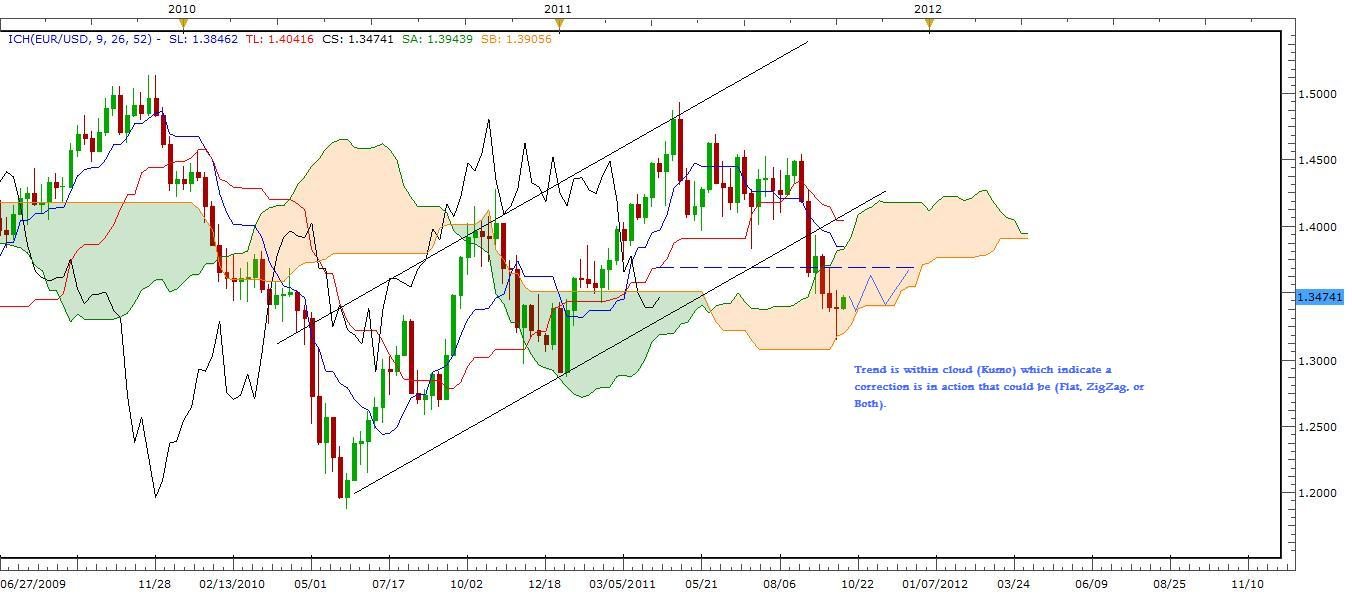
Looking at weekly Ichimoku Chart, we can notice that trend has entered the Cloud (Kumo) which tells us that we are going into a correction wave that makes me expect Zigzag, Flat, or combinations before trend leaves the cloud into another major trend either upward or downward. In general trading corrections is very risky so that drives me to zoom the weekly chart to a 4hour chart below to recognize any trading opportunity within Kumo.
4Hour:
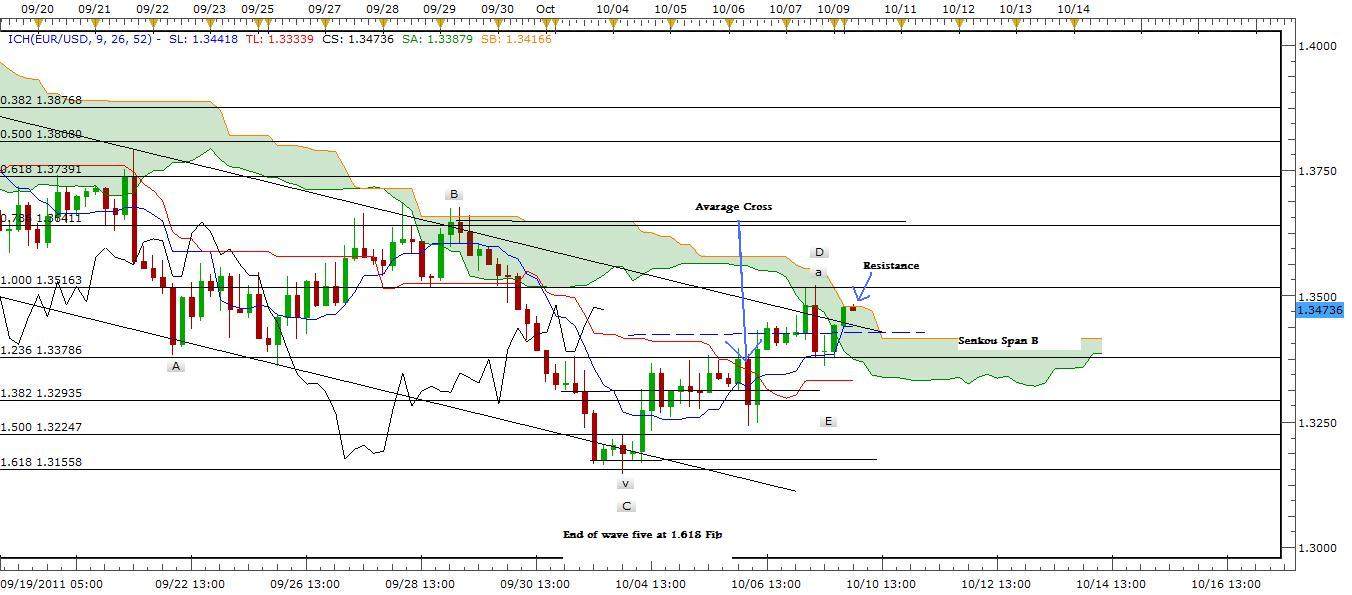
We can see clearly at this chart that wave five completed at 1.618 Fib level or 1.31558 and moved into a correction stage that again either ZigZag, Flat, or both. We see the two averages Tenkan sen 9 days (Blue) has crossed Kijun sen 26 days (Red) which indicate and upward movement is on the way but a resistance from Senkou Span B 52 days (Brown) is pushing trend down. Opportunity of breakout happens here once trend break the 52 days average which I expect for the coming few days.
1Hour:
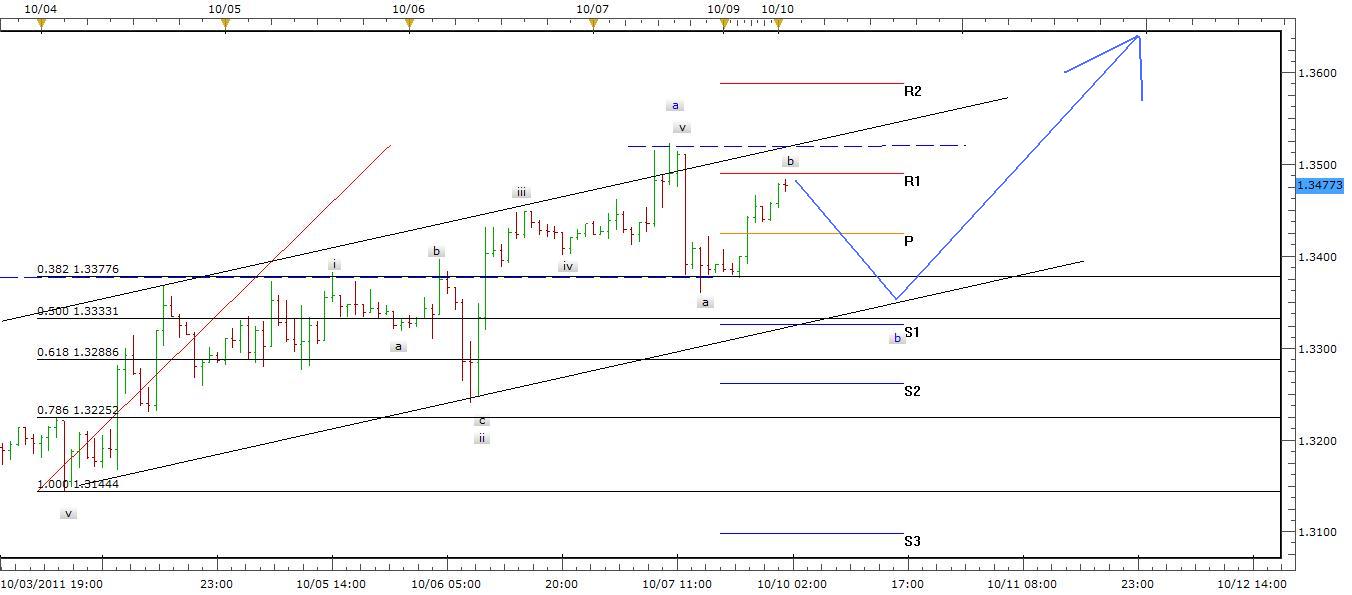
I set my plan here based on Elliott waves targeting wave B at 0.5 Fib
level before I buy.
Strategy: Elliott wave
Focus: ZigZag, Flat, Corrections
Signal I : once pattern complete wave b in 1H chart, I will buy as shown
(Blue arrow)
Signal II: once trend breaks Kumo in 4H chart.
Note: Follow us on Twitter to get all of our updates instantly.


