By: Doug Rosen
I start out looking at the EUR/CHF, it is a new week of course and we are just up against the descending trend line we have been stuck at for the past couple weeks. This trend line seems to be holding since it is overlapped by a fib level between 61.8 and 78.6 as well as a 55 ema and the stochastics is in the overbought zone based on the weekly chart. On the daily the ema's are all bunched very close to each other. If price breaks this trend line it will do it soon or it will just drop. On the lower time frames ema's are all just braided together, no speed or momentum exists. Looking at the GBP/CHF it appears that the GBP has not been fighting as hard as the EUR and the ema's are rolling over.

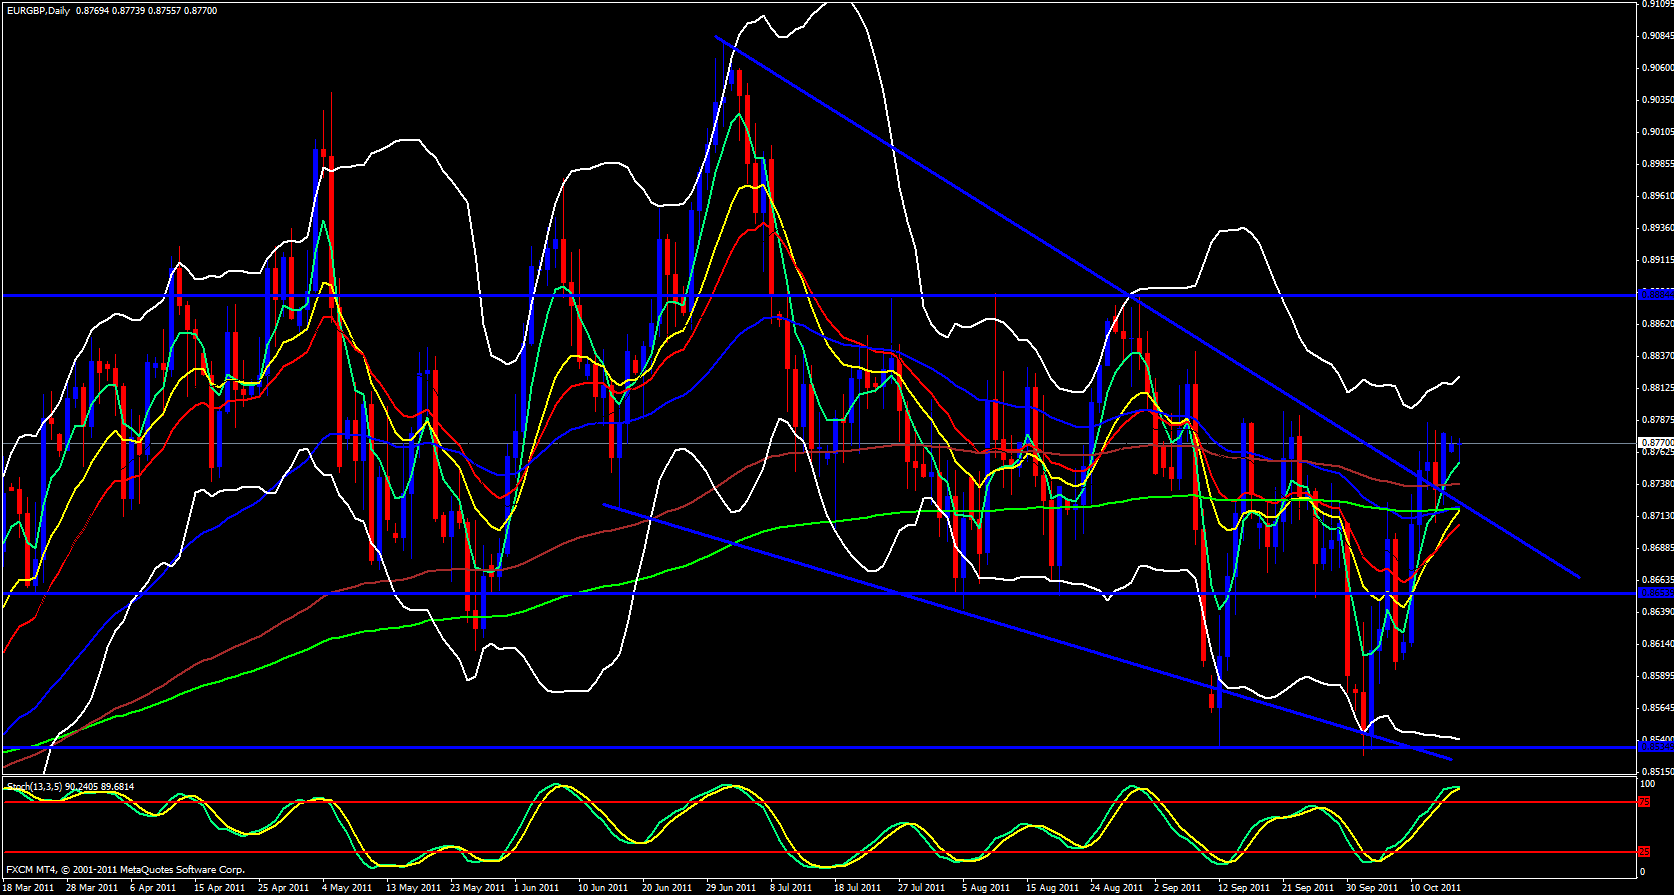
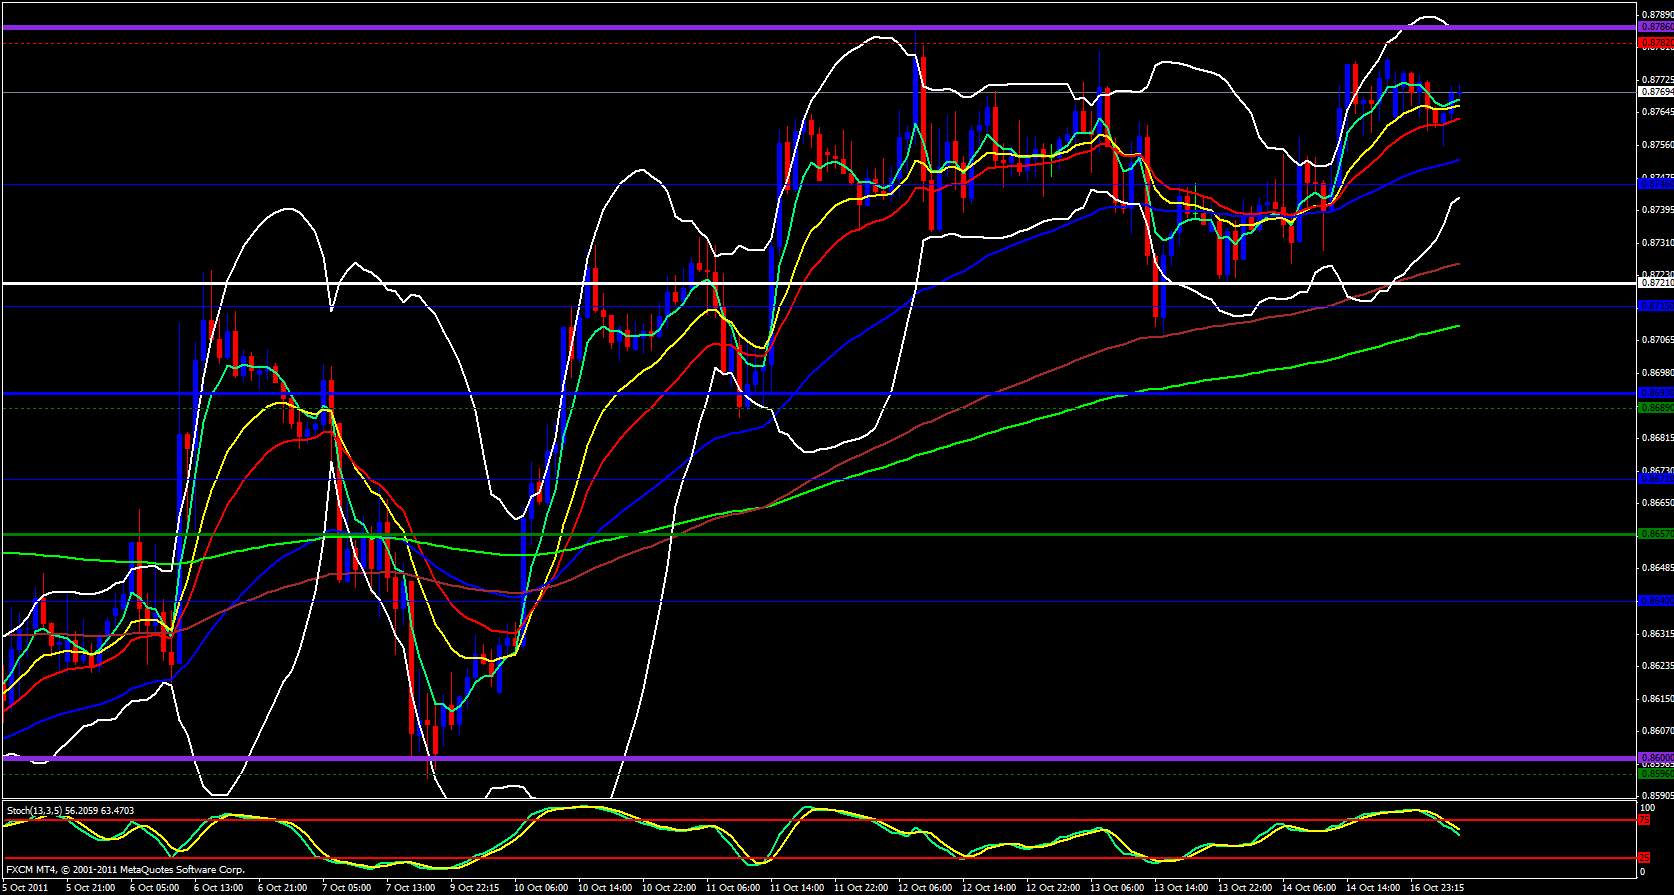
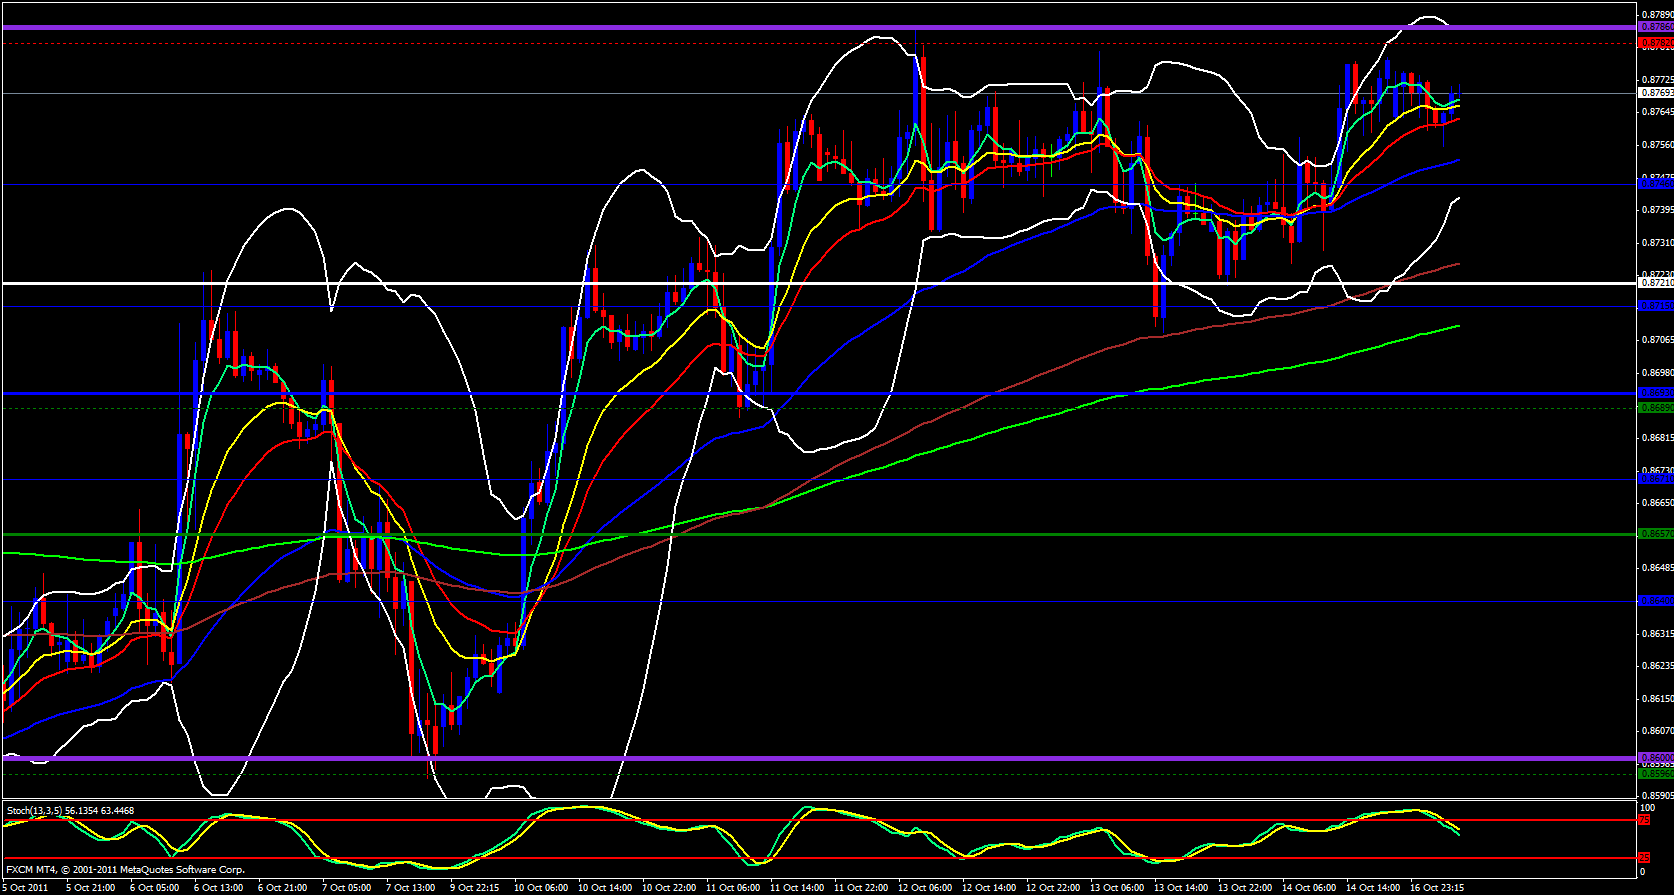
Looking at the 4 hour and 1 hour charts I see price is already underneath the ema's. Obviously the EUR is stronger than the GBP. Looking at the EUR/GBP weekly chart it is very obvious which is stronger, the EUR of course, however, price is at a gap from the 5 ema and I do believe price may soon have to slow down a bit and give the ema's a chance to catch up a bit. We have busted a trend line and a retracement may soon be in order. Moving over to the daily chart we can see that price has bounced off the 5 ema yet the stochastics is in the overbought zone. It would not be unreasonable to expect price to fall back down a bit before continuing to the upside. I see some visual resistance coming up on the 4 hour chart around 0.8781 so this level could be the level that pushes price back down to the ema's. 0.8786 just happens to be last week's high and 0.8780 was Fridays high and on the 4 hour chart we are in the overbought zone and the 1 hour stochastics is falling and pointing down and on the 15 minute it is in the overbought zone. It's possible that a bounce down could give the GBP a bit of extra strength today.


