See this EUR/JPY technical analysis implemented on a binary options platform.
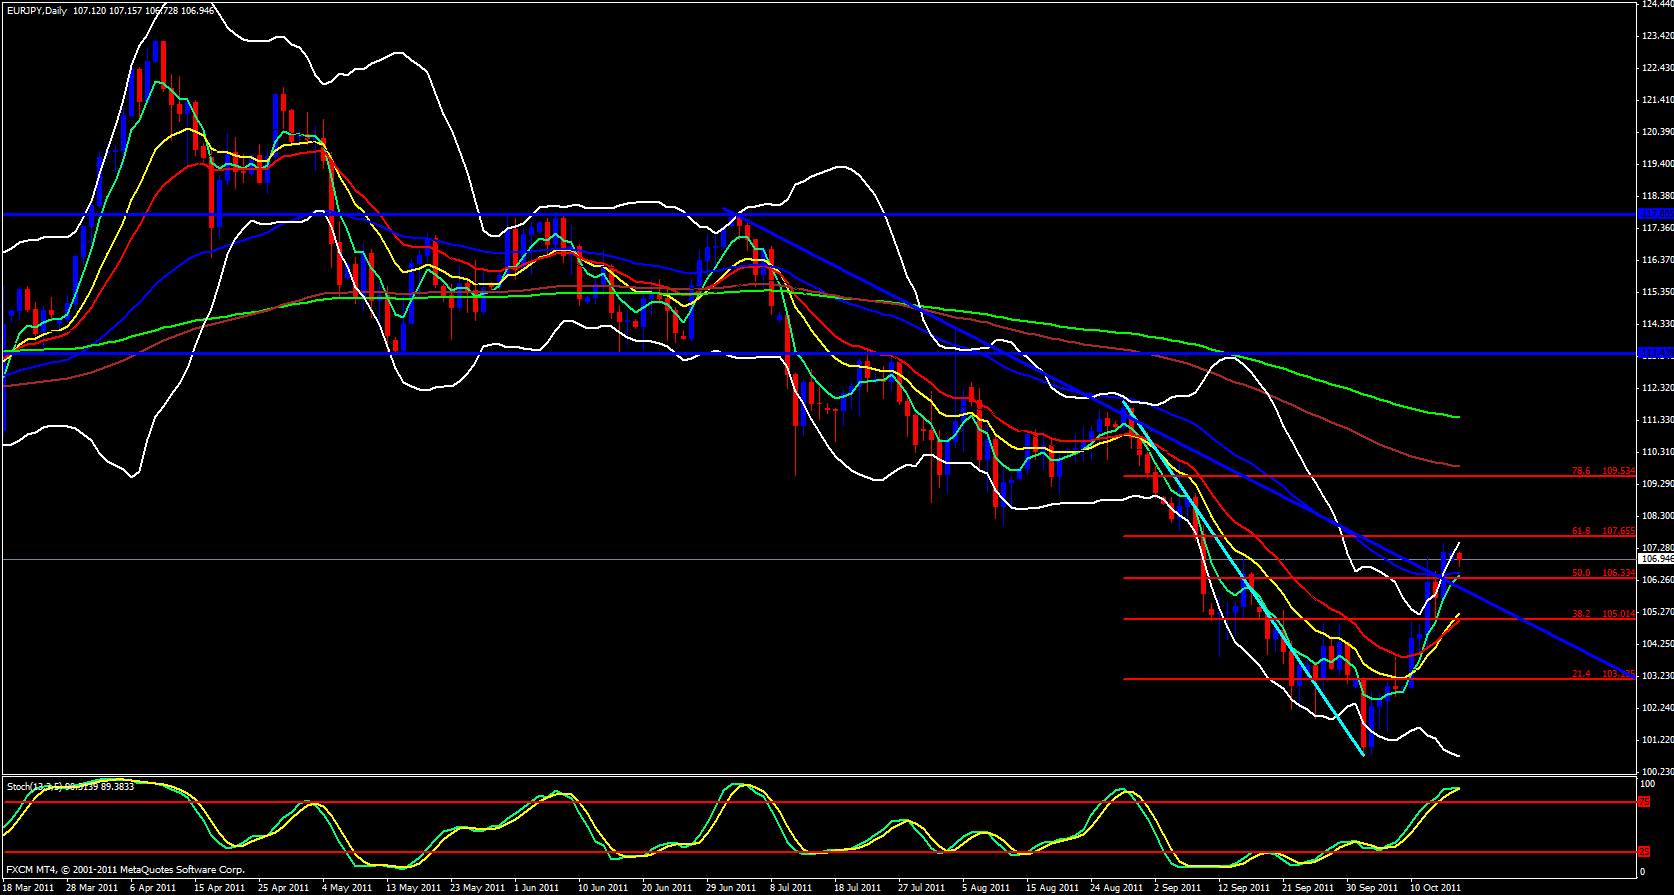
Starting out with the weekly chart this week's starts out with price up against the 13 ema overlapped with a 38.2 fib of the recent swing down. Moving over to the daily chart price has been riding the 5 ema but is approaching a 61.8 on the recent daily swing down and almost touching the upper Bollinger band with a stochastics in the overbought zone. This is where I would expect pullbacks to begin to take place. It is also very important to note that according to my point of view, the USD appears to be slightly stronger than the JPY at this time.

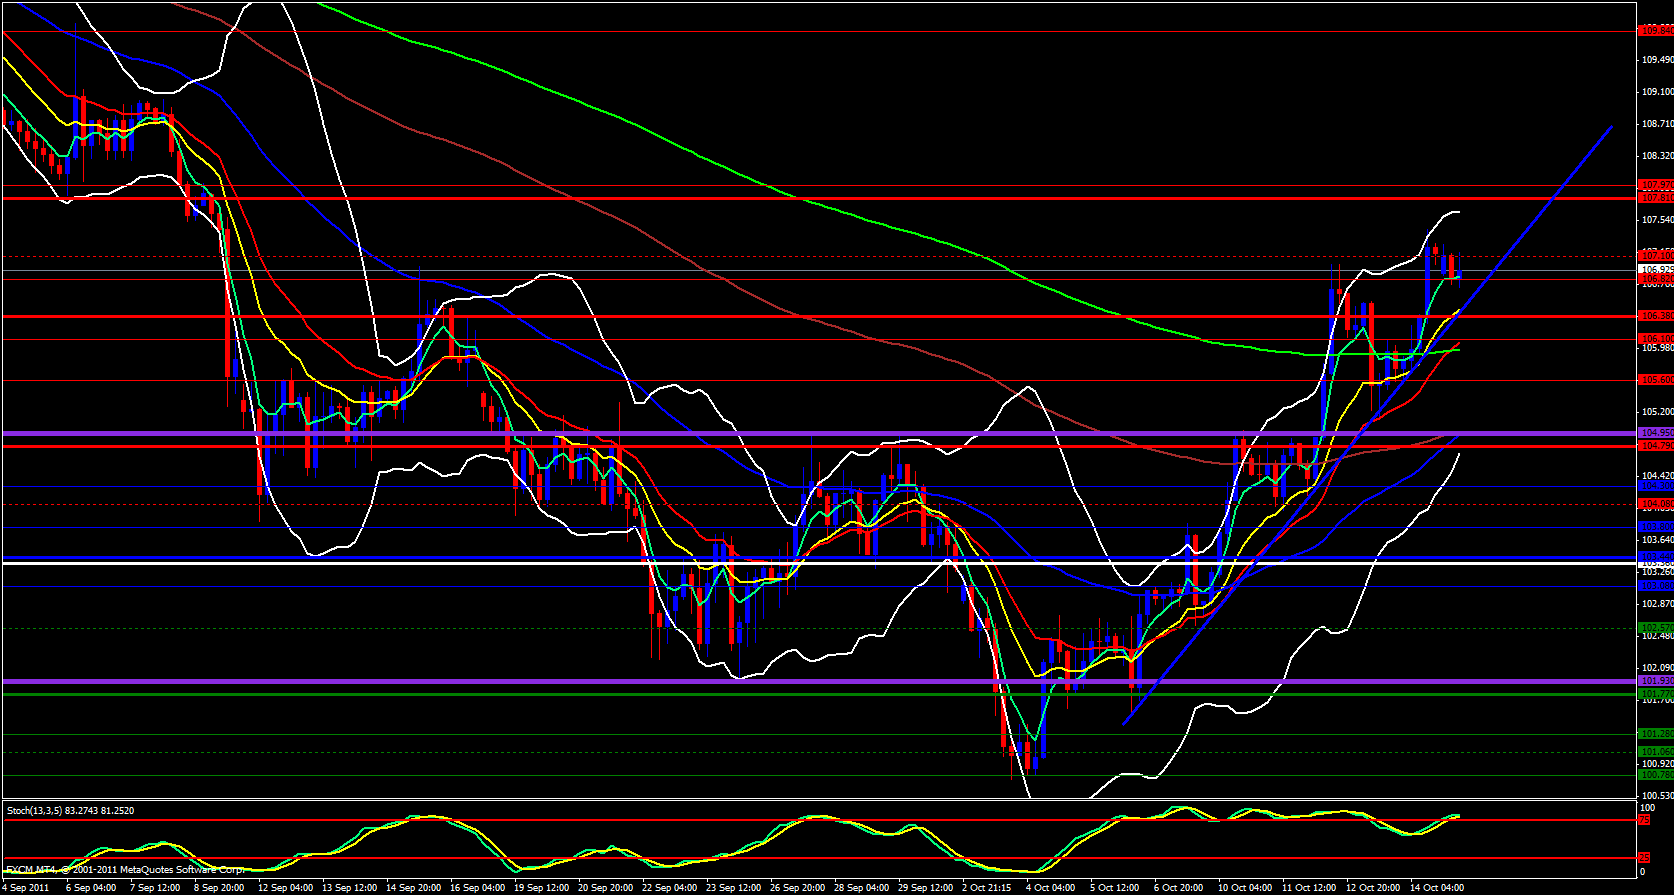
Moving over to the 4 hour chart price is riding the 5 ema up and climbing up my ascending trend line. Price is wicking the monthly M5 pivot point as I am writing the analysis. Price is also approaching last week's high and on the hourly upper Bollinger Band is beginning to sharply point downward.

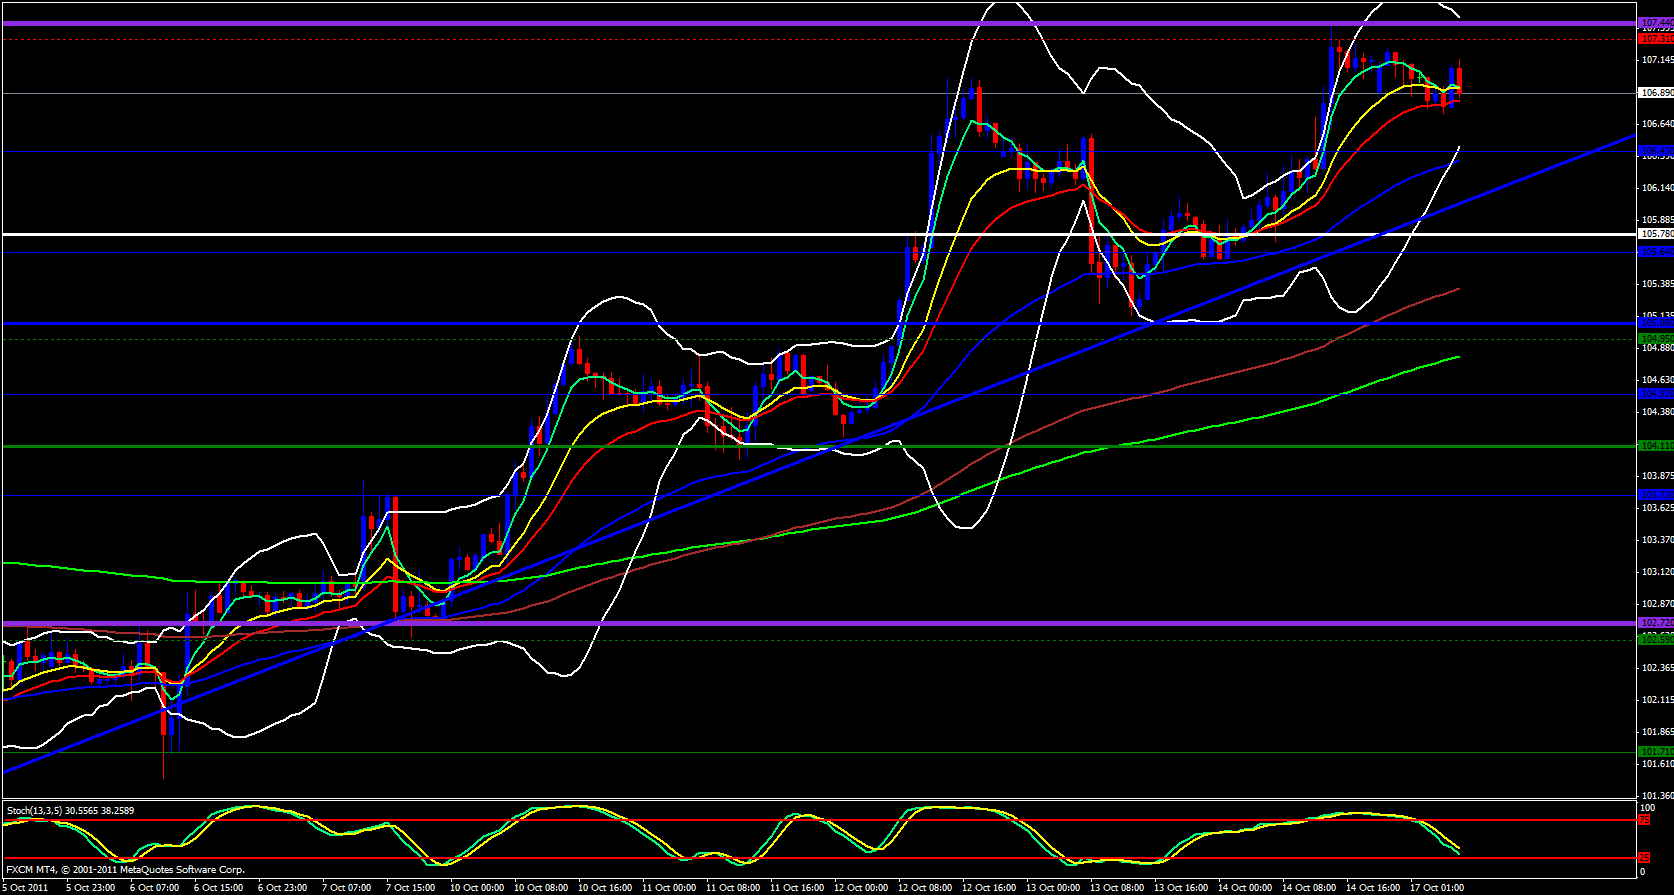
On the 15 minute chart price is beginning to make a series if lower highs and lower lows. Remember, the EUR/USD and the EUR/JPY are very closely correlated. What one pair does the other pair follows. Sometimes the EUR/USD leads and other times the EUR/JPY takes the lead. Use the two pairs together. When they both hit resistance, expect them both to fall. Gauge the USD/JPY and the EUR/USD to determine which is weaker, the USD or the JPY and do the same with EUR and GBP and plan your trades accordingly. Always remember, pair the weakest currency with the strongest currency. Be sure to read my analysis on all five currency pairs I write about on a daily basis to get a handle on what to trade and what not to trade.


