By: Doug Rosen
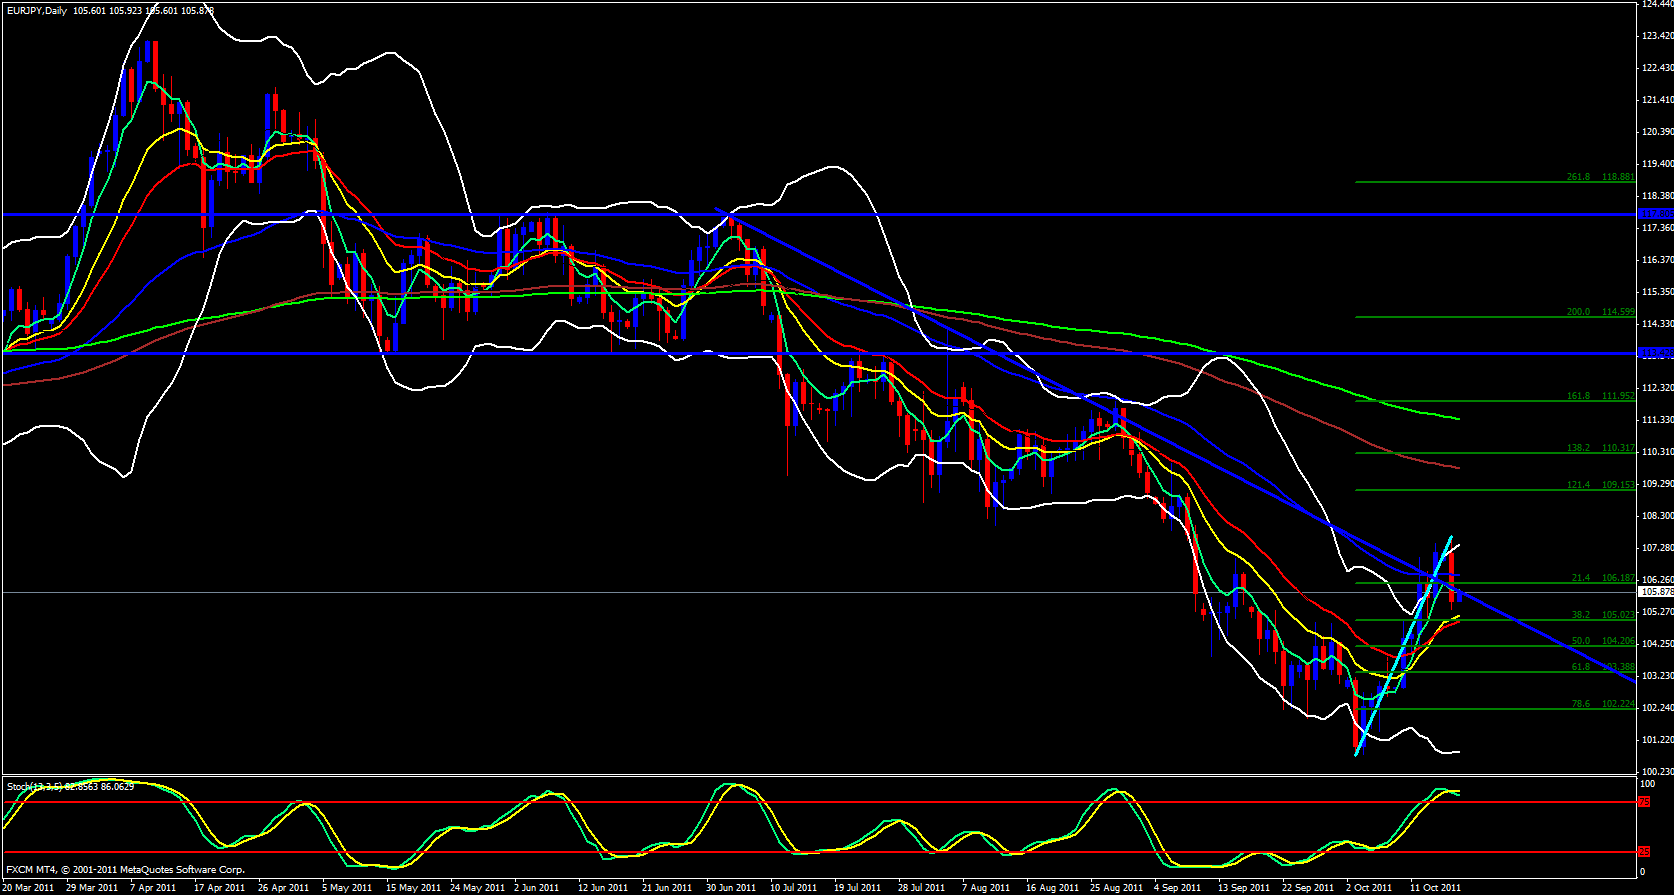
If it weren't for the fact that this pair is so closely correlated with the EUR/USD I could be kind of lost tonight but it is closely correlated and since the EUR/USD appears to be bullish to me and the USD/JPY is range bound I will maintain a bullish bias on this pair today. When I look at this pair on the weekly chart it appears that price had broken support then retested at a 38.2 fib overlapped with a 13 ema. This would of course appear to be very bearish in nature. However, the weekly 5 ema is below the weekly candle and the stochastics is in the oversold zone. Now, moving over to the daily chart it appears that price has fibbed to the upside. Not quite a 38.2 fib but in between the 21.4 and 38.2 with the13 ema crossing above the 21 and the upper Bollinger band open and pointing up. I also want to note that we have broken a descending trend line as well.
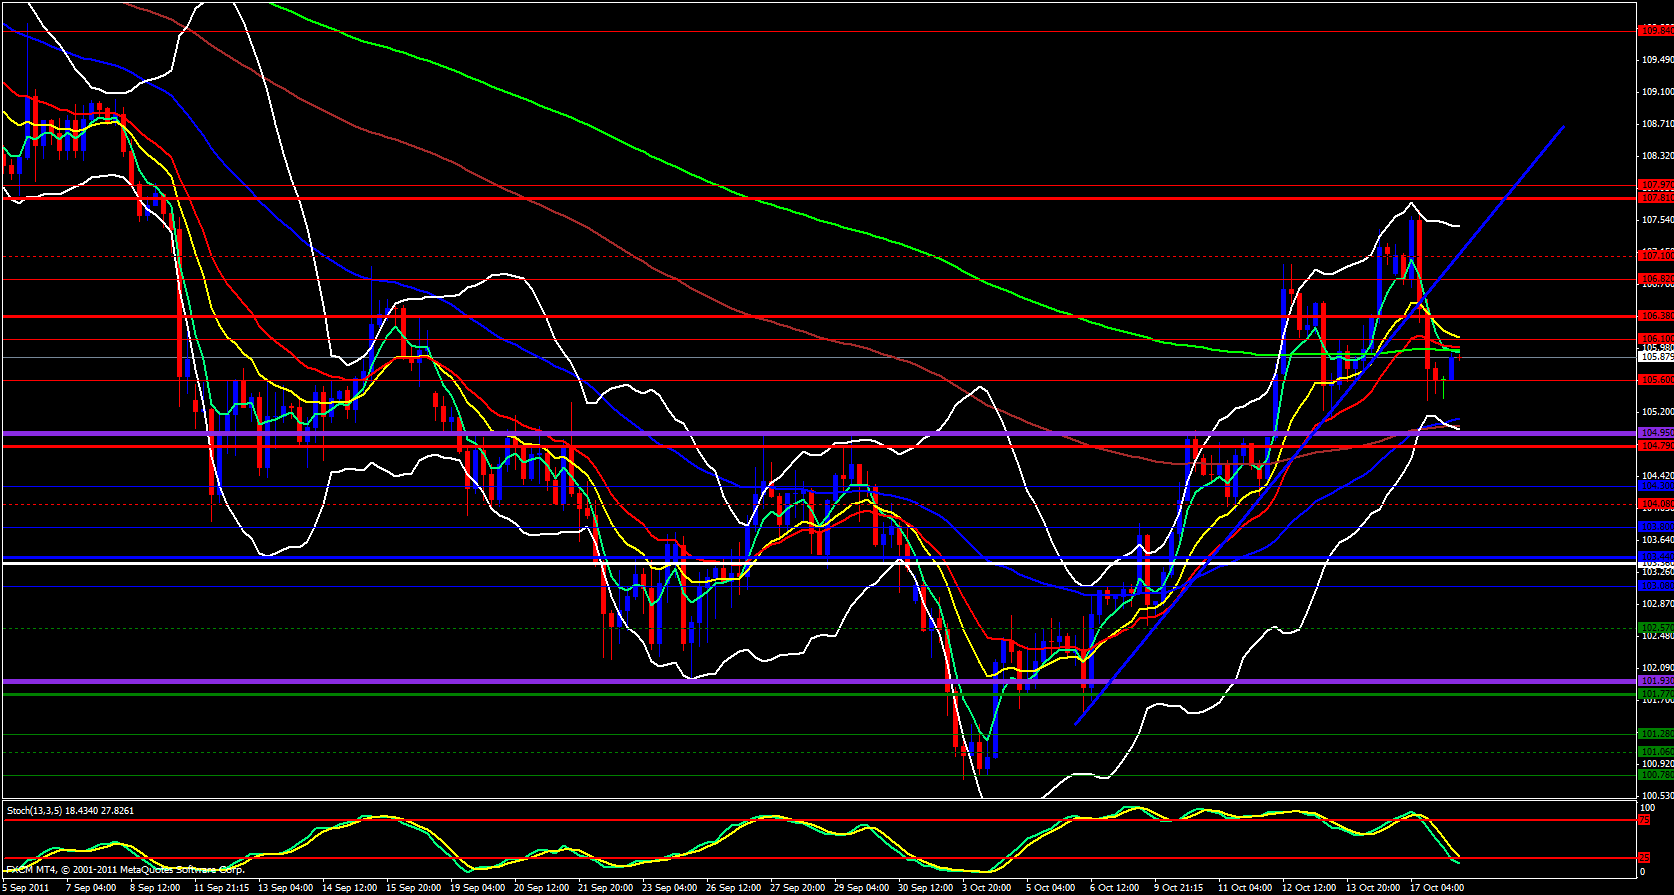
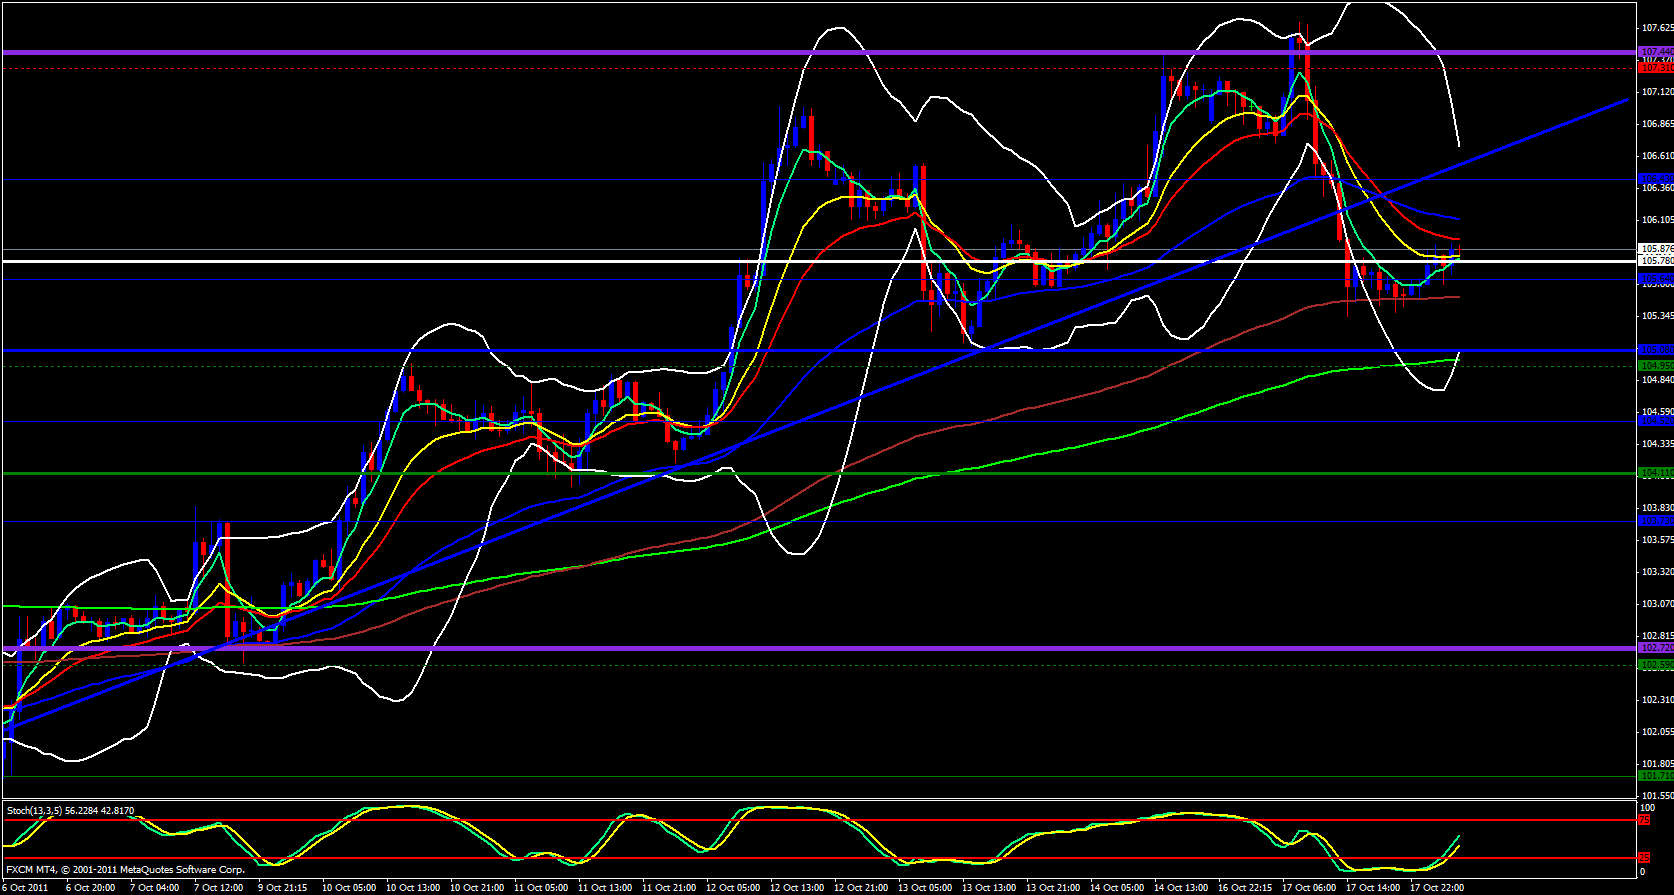
Price is above last month's high and the 4 hour stochastics is in the oversold zone. Moving over to the hourly chart the 5 ema looks like it does want to cross above the 13 ema and price has just risen above the weekly central pivot point and the stochastics has crossed upward into the trade zone. Looking at the 15 minute chart I see we have made a couple sets of higher highs and higher lows, however, I cannot ignore the fact that the 38.2 fib level 106.22 of yesterdays move down does overlap with the daily central pivot point at 106.18 with the 233 and 144 ema just a bit below that level. No question about it, there will be a fight at that level, however, if price can break above it, I can see price heading up to 107.67 or beyond.


