By: Doug Rosen
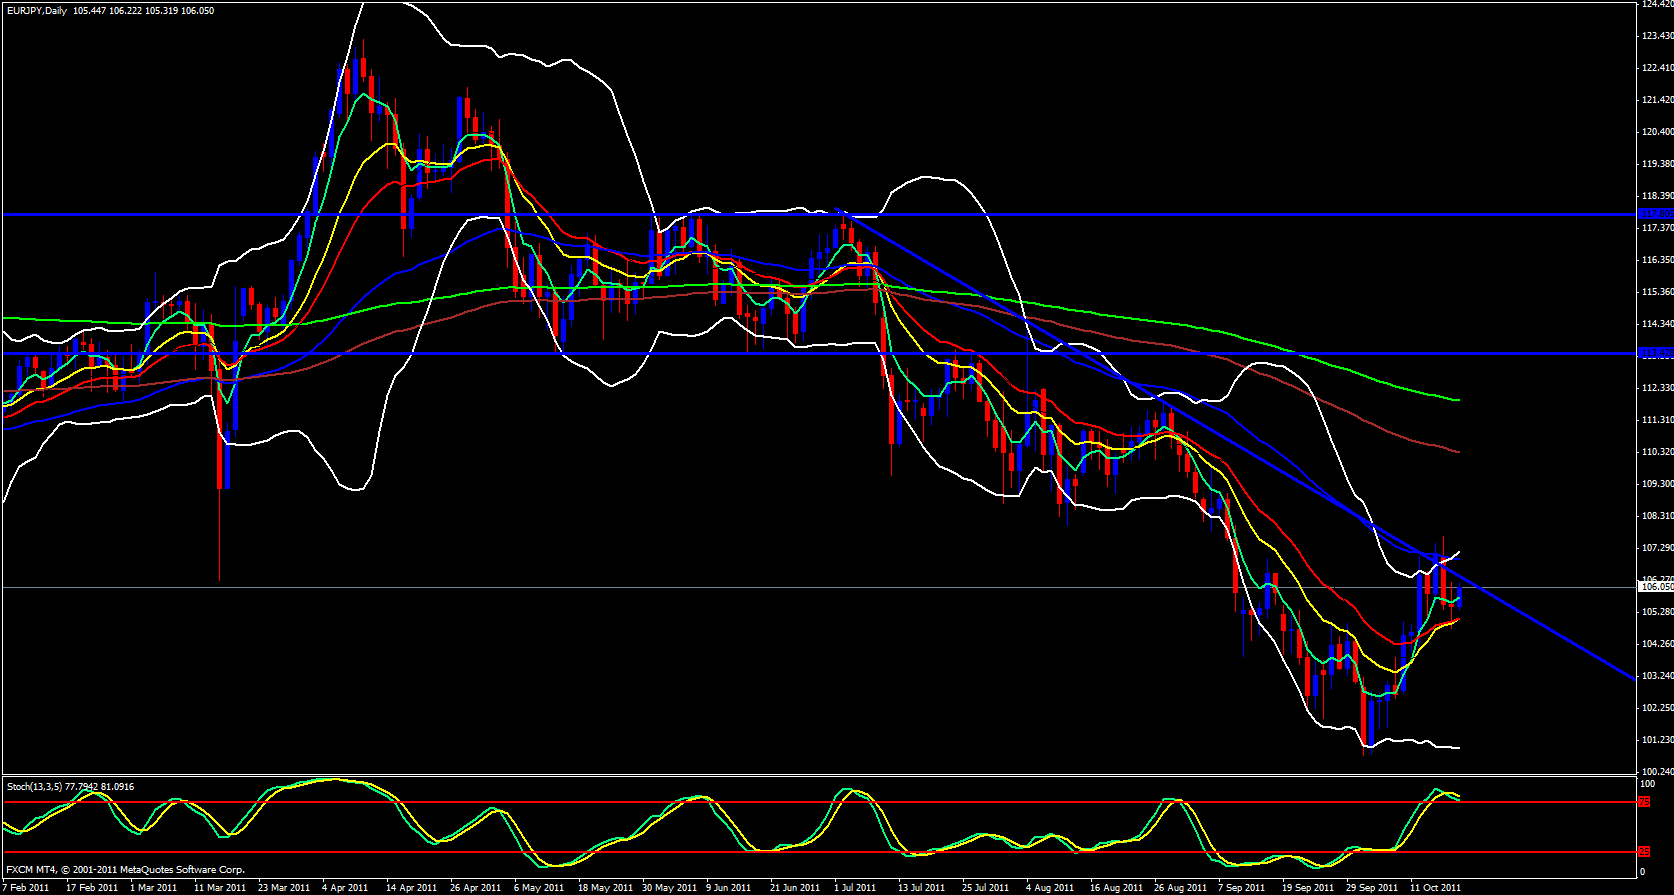
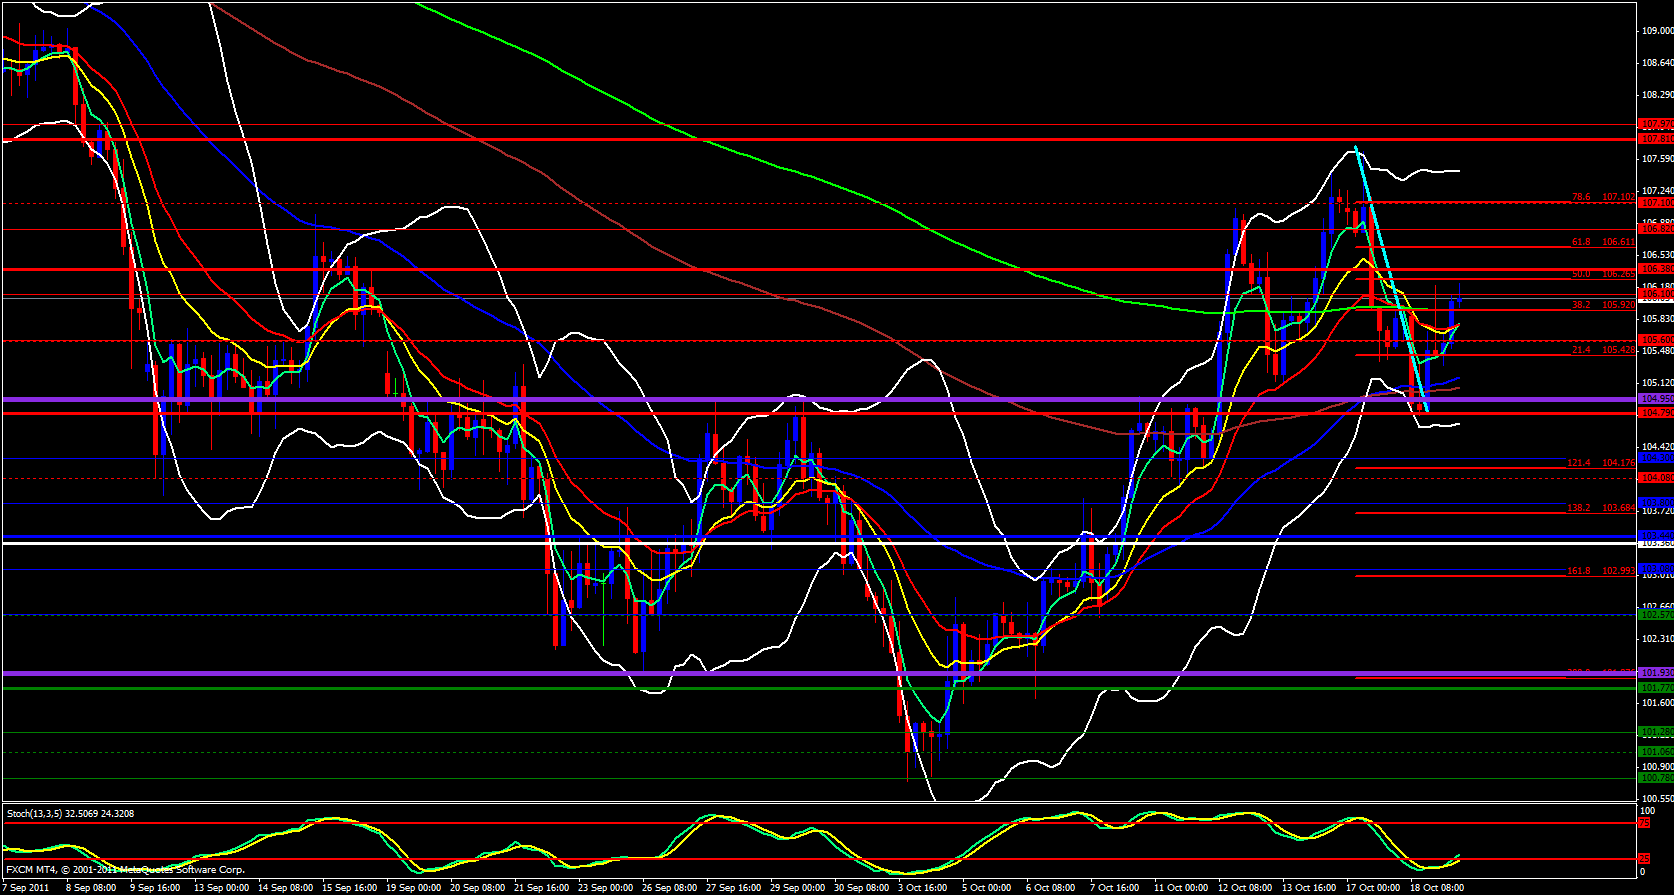
I start out with this pair looking at the weekly chart and it is obvious that price recently made a 38.2 fib of the recent swing down, overlapped with a 38.2 fib. On the daily chart, we have fallen down below the descending trend line, however, price is still be supported by the 13 and 21 ema's underneath and the upper Bollinger band is wide open and pointing up just a bit. Price is definitely in an area where a decision will soon need to be made. Price is approaching the monthly R2 reversal pivot point around 106.38 and looks as though price is developing a complex top pattern could also be a Head & Shoulders pattern.
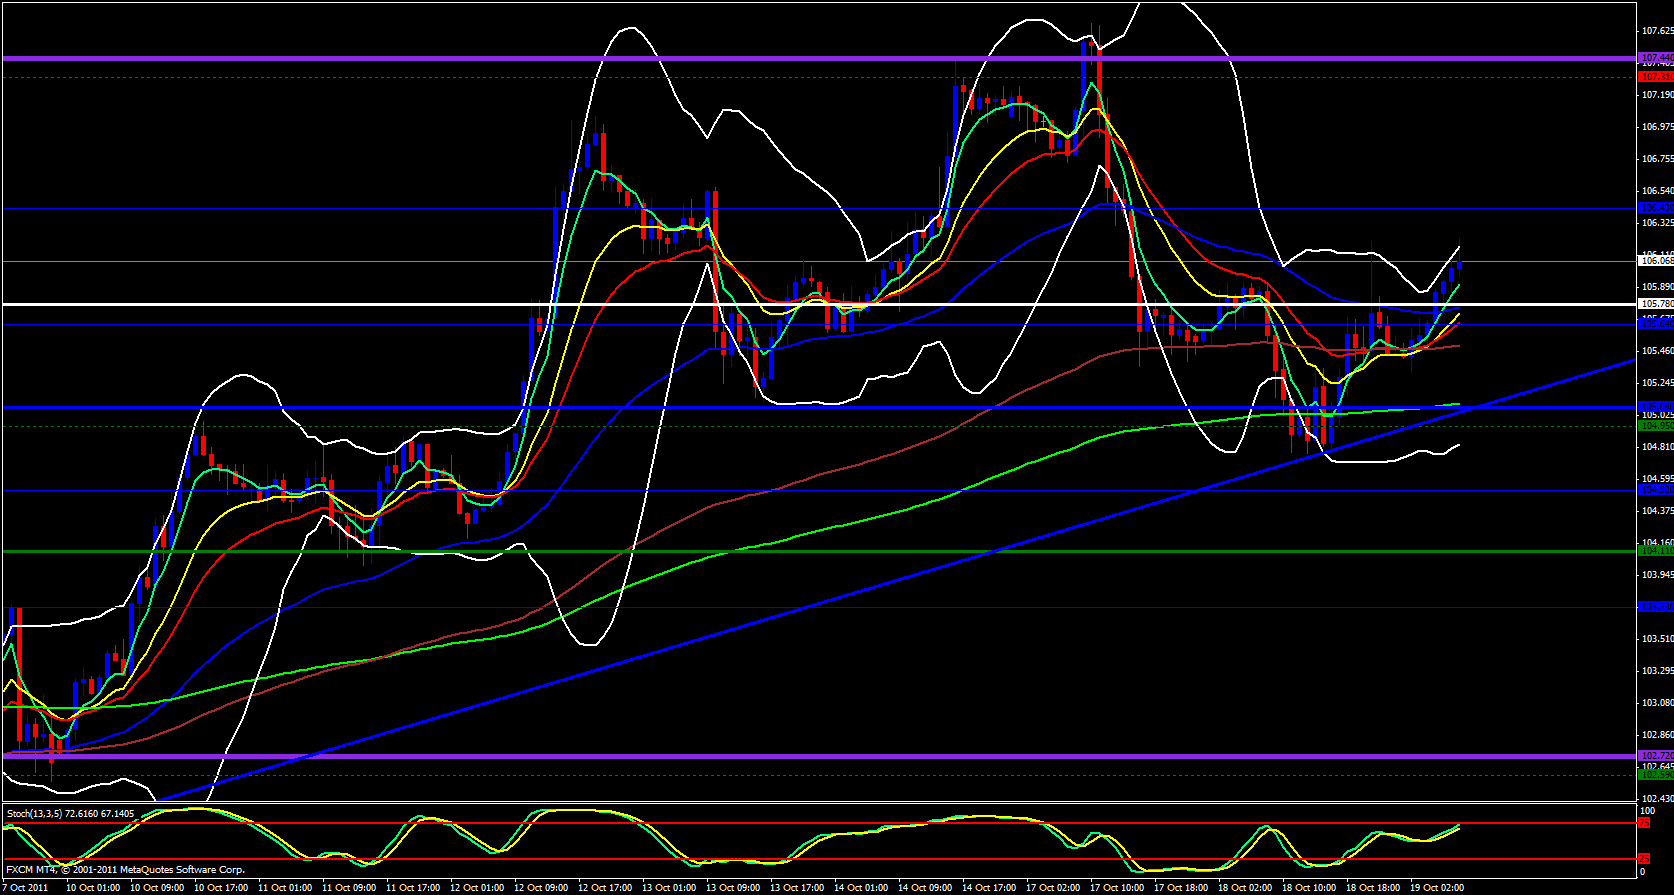
Moving on to the 1 hour chart price still looks incredibly bullish and there is very little or no resistance to really speak about. Price has come up to yesterdays high which just happens to be just a few pips below the R1 Daily Pivot and the stochastic is in the overbought zone. This pair is trending quite well to the upside and I really do not see much reason for this to change other than profit taking. For price to really take off it will need to break above 106.50 but at this time does find itself against some resistance.


