By: Doug Rosen
Starting out with the EUR/JPY weekly chart I see that price recently broke support and has retested back to the scene of the crime, has touched the 13 ema and should continue to drop for a bit.
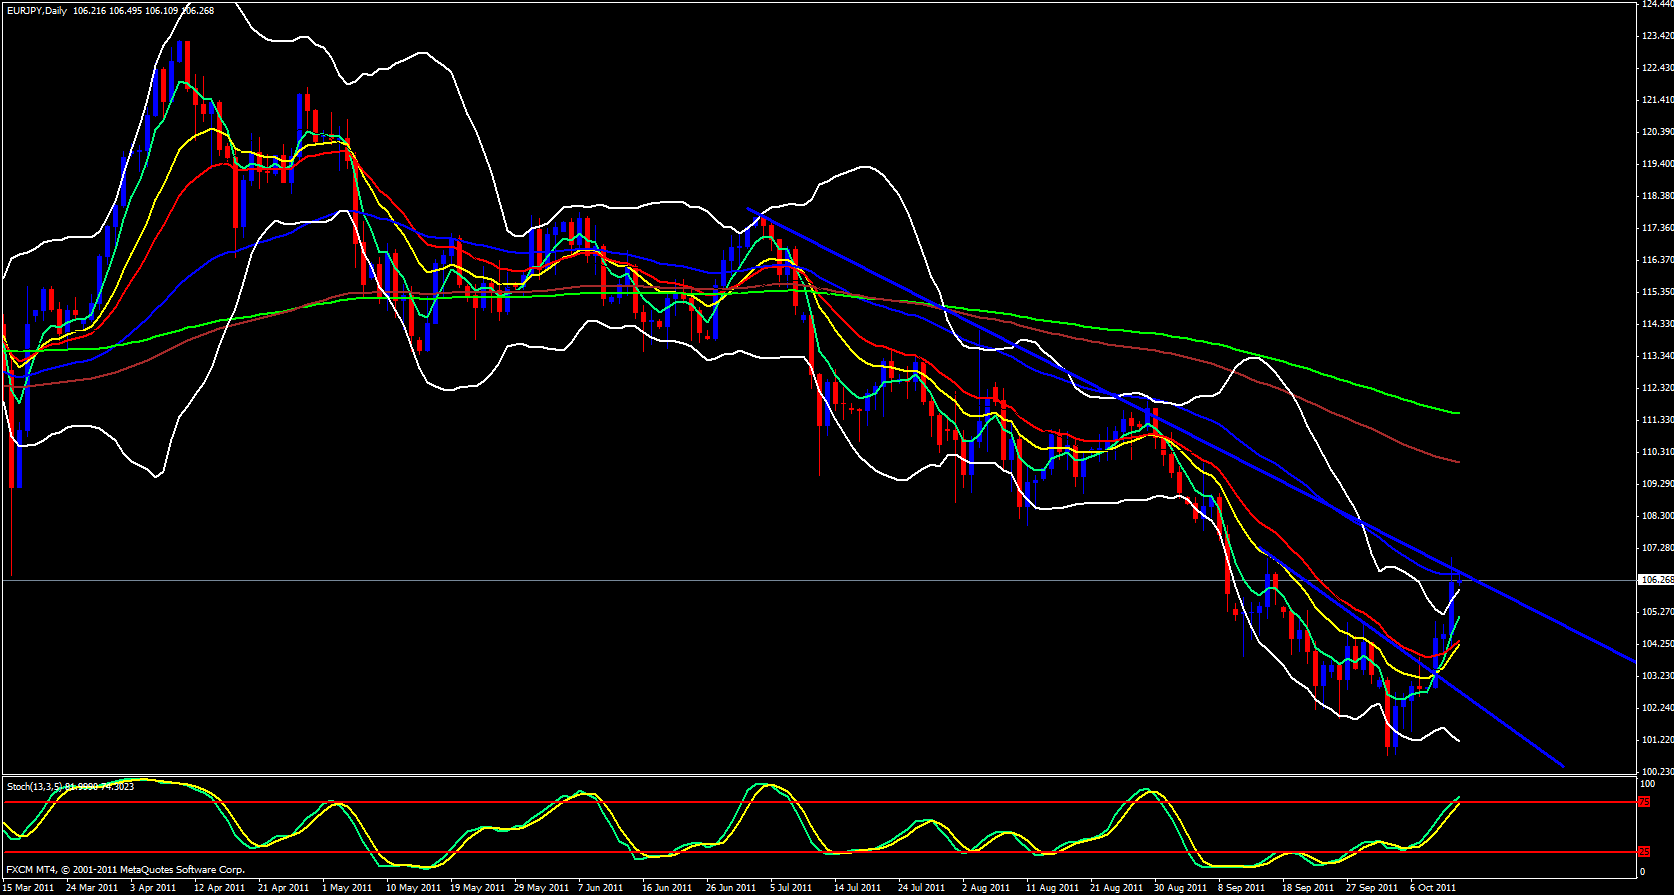
Moving over to the daily chart I see that price has made contact with he 55 ema which overlaps with a descending trend line and a stochastics in the overbought zone and considering price has gapped a away from the 5 ema I think it needs to slow down a bt and let the ema catch up to price or come down and meet it half way. I expect this pair to drop just a bit.
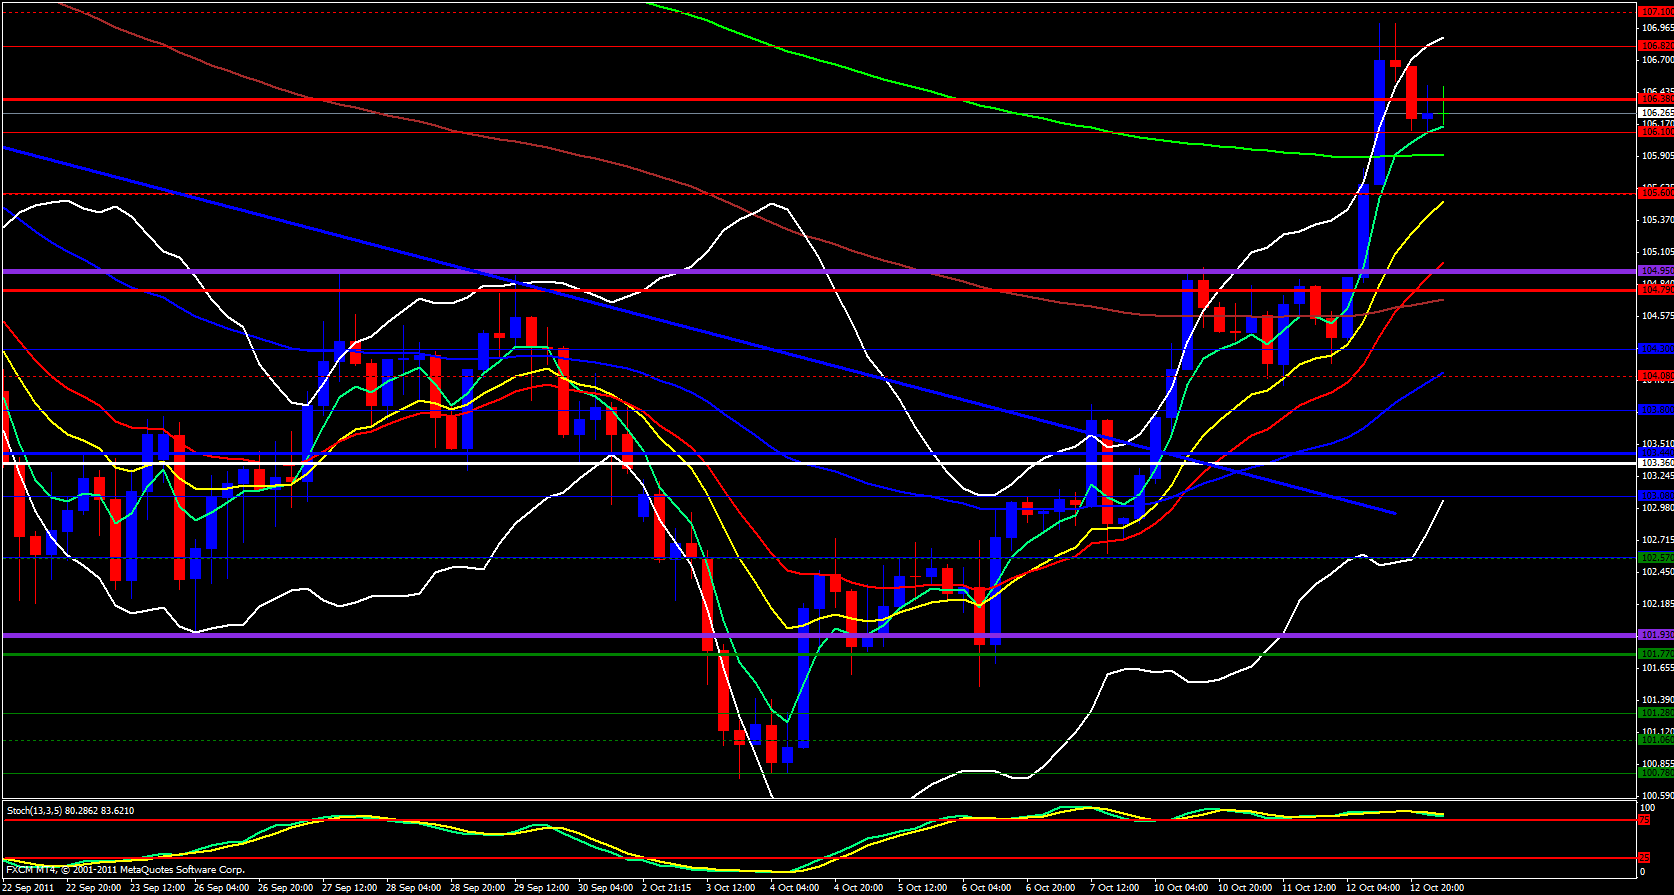
Moving on to the 4 hour chart I see it is bullish and that price is in fact riding the 5 ema up, price is still up against the monthly R2 and the stochastics is in the overbought zone. In addition, the candle formation looks like a reversal formation.
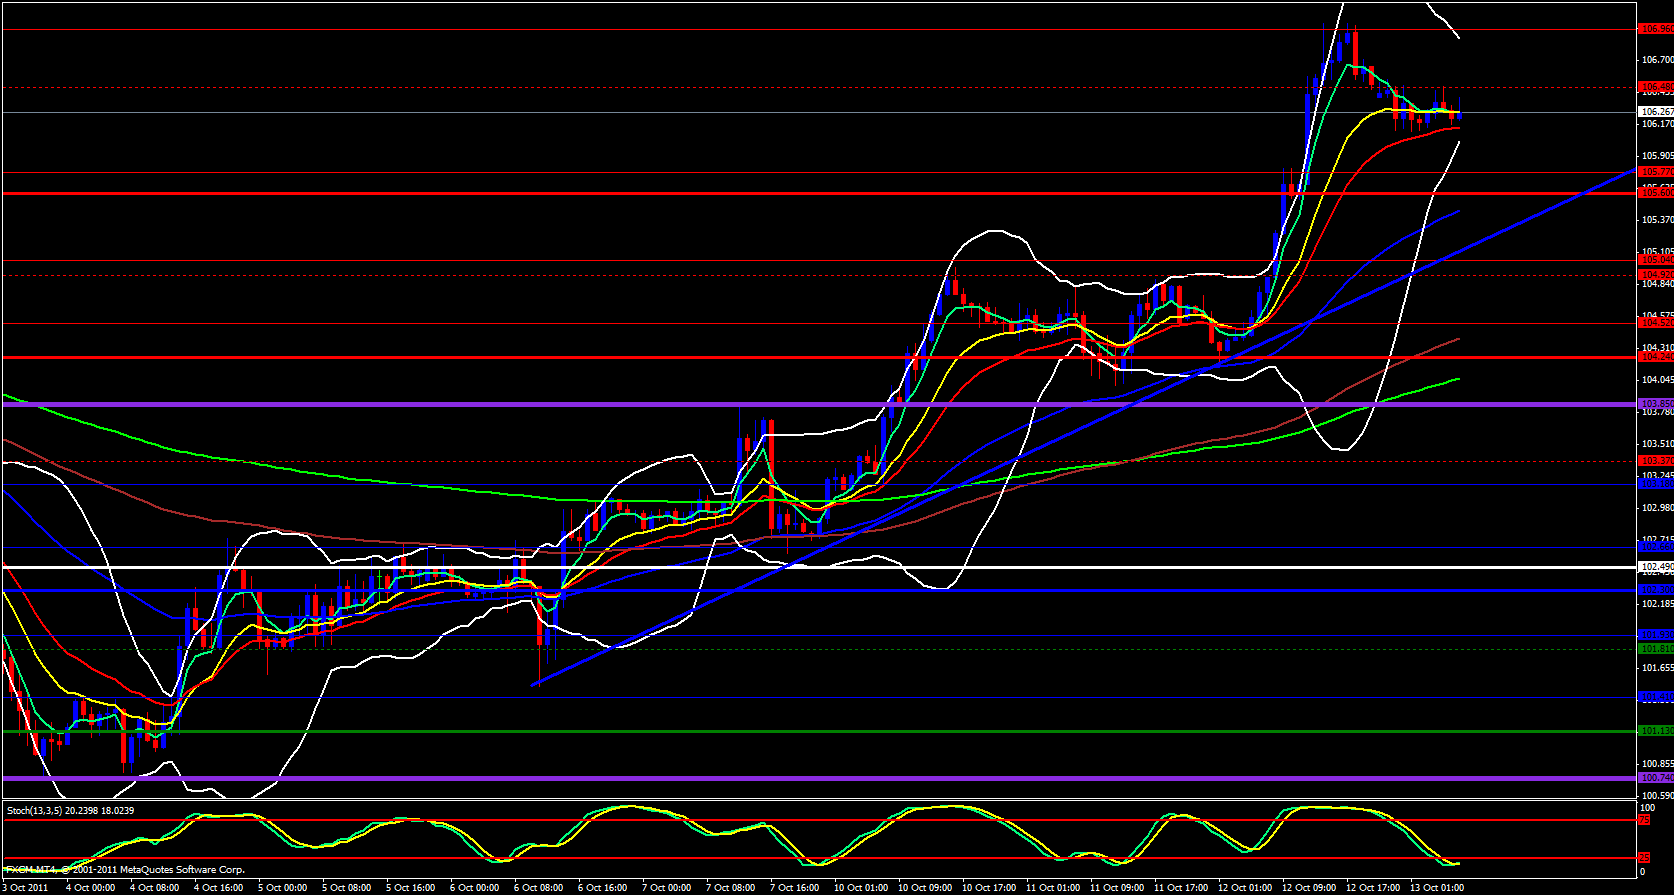
Moving over to the 1 hour chart I see that price has also hit the weekly M5 and profit taking and sell action should be expected at that level.
Finally, I look at the 15 minute chart and it doesn't tell me a whole lot at the moment. Price should head back down to the daily central pivot point which overlaps with the 144 ema and then expect a bounce or a breakout.


