By: Colin Jessup
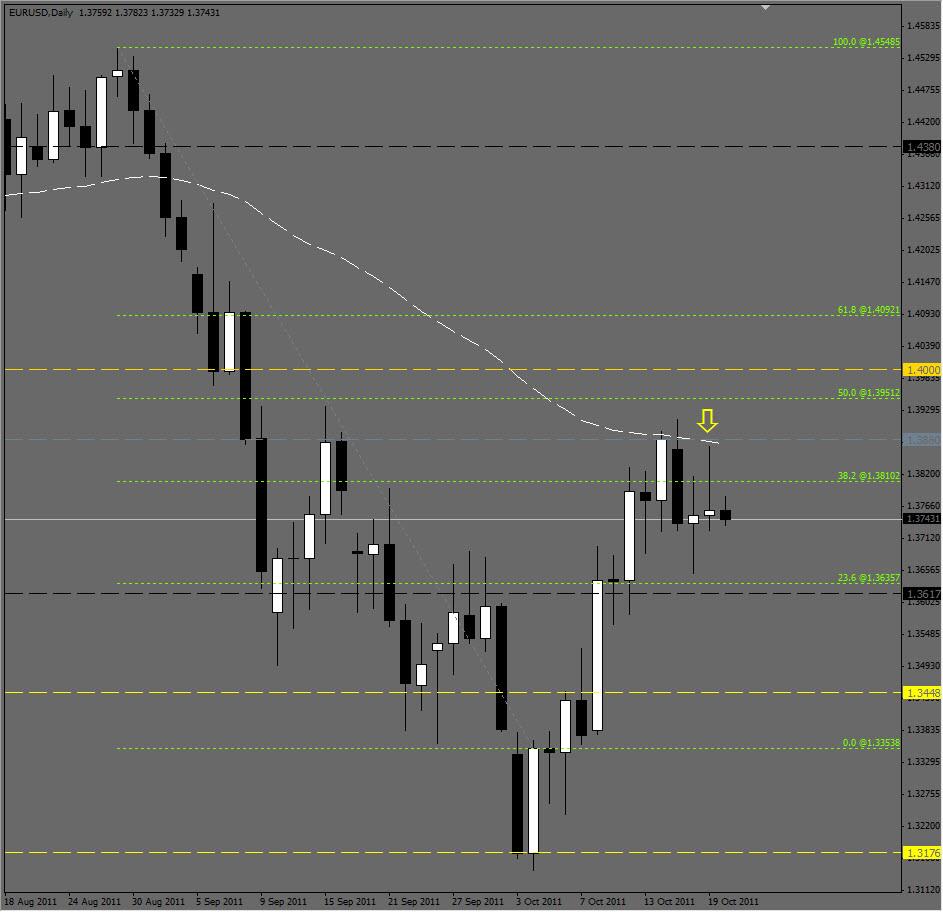
The EUR/USD pair made some bullish movement in yesterdays trading, but could not hold off the bears...for the second day in a row. Although the pair closed higher than it opened and technically speaking had a bullish day, the daily chart is looking very bearish to this trader. Price has not been able to close above the Daily Moving Average, after attempting to do so for 4 days in a row. Placing a Fibo tool on the high of August 29, 2011 and tracing down to the low of October 4th, 2011 we see that price is struggling to close above the 50% retracement level and in fact has retraced more than 38.2%, but not quite 50%, and has also closed below the 38.2% level of 1.38102 4 of the last 5 trading days.
If price continues to fall look for support between 1.3600-1.3650, then 1.3500 and 1.3450 below that. Should price make a move for the upside we should see resistance at 1.3880, again from the 50% level at 1.3950 and 1.4000. One last observation is that price is currently falling while I compose this article, which is at 11:00AM in Hong Kong...price tends to move in the opposite direction during the Asian sessions in relation to the UK or USA sessions, but not always.


