By: Doug Rosen
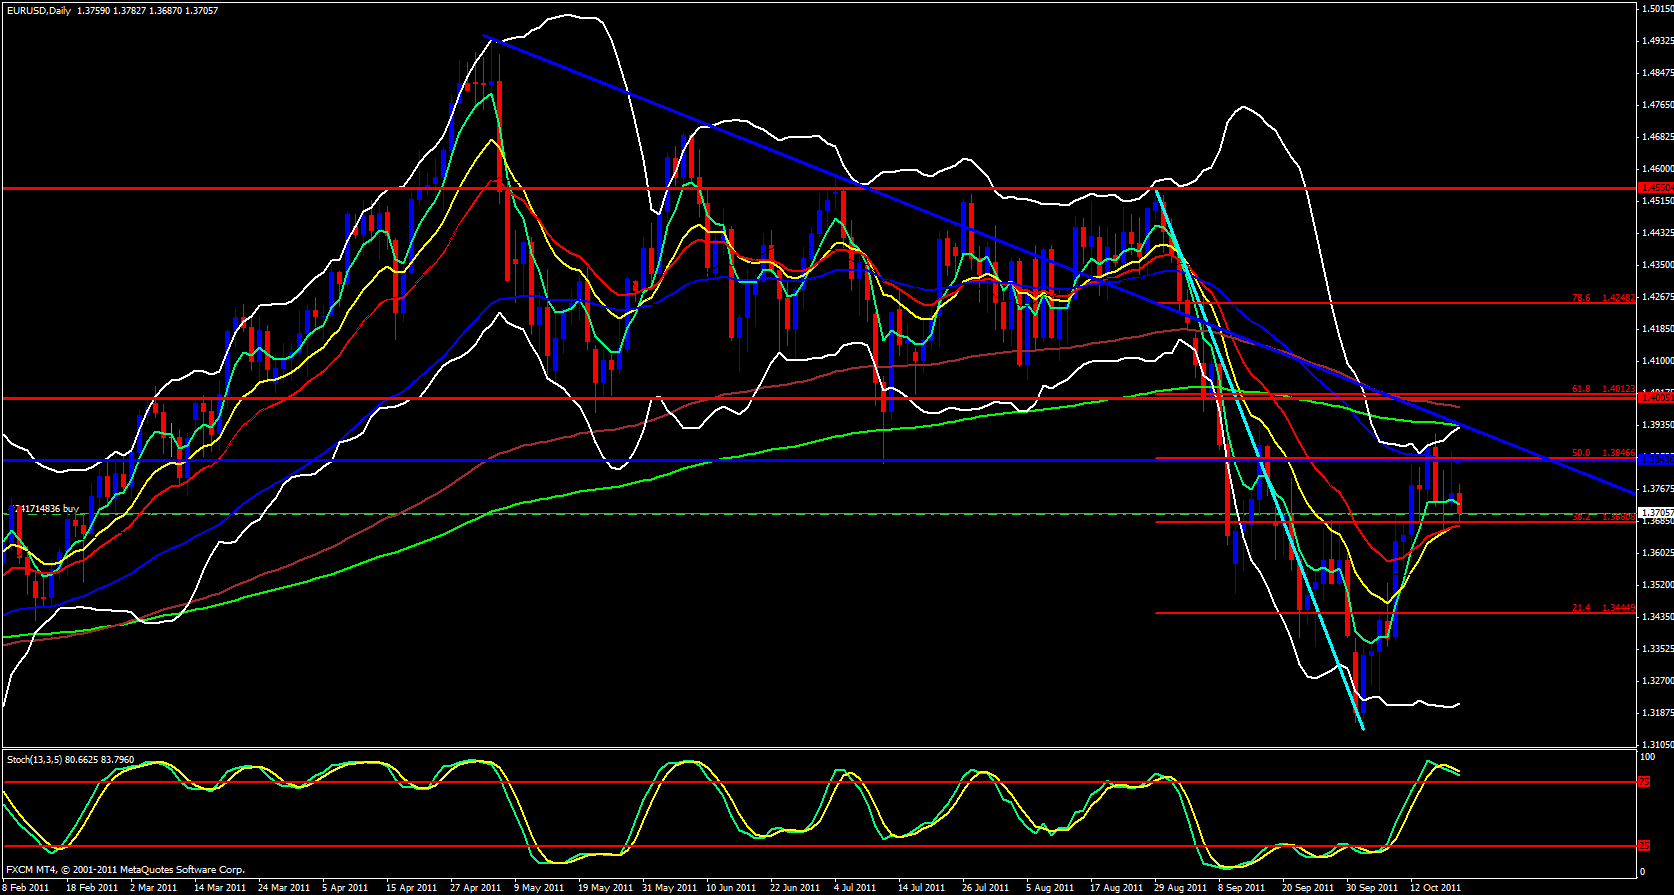
Price has fallen down to the 21 and 13 ema's, however, the USD has recently picked up strength and the stochastic is in the overbought zone and I see the daily 5 ema rolling over to the downside so I do expect price to break the 1.3700 level but not without a fight since this level has proven itself to be a strong area of support.
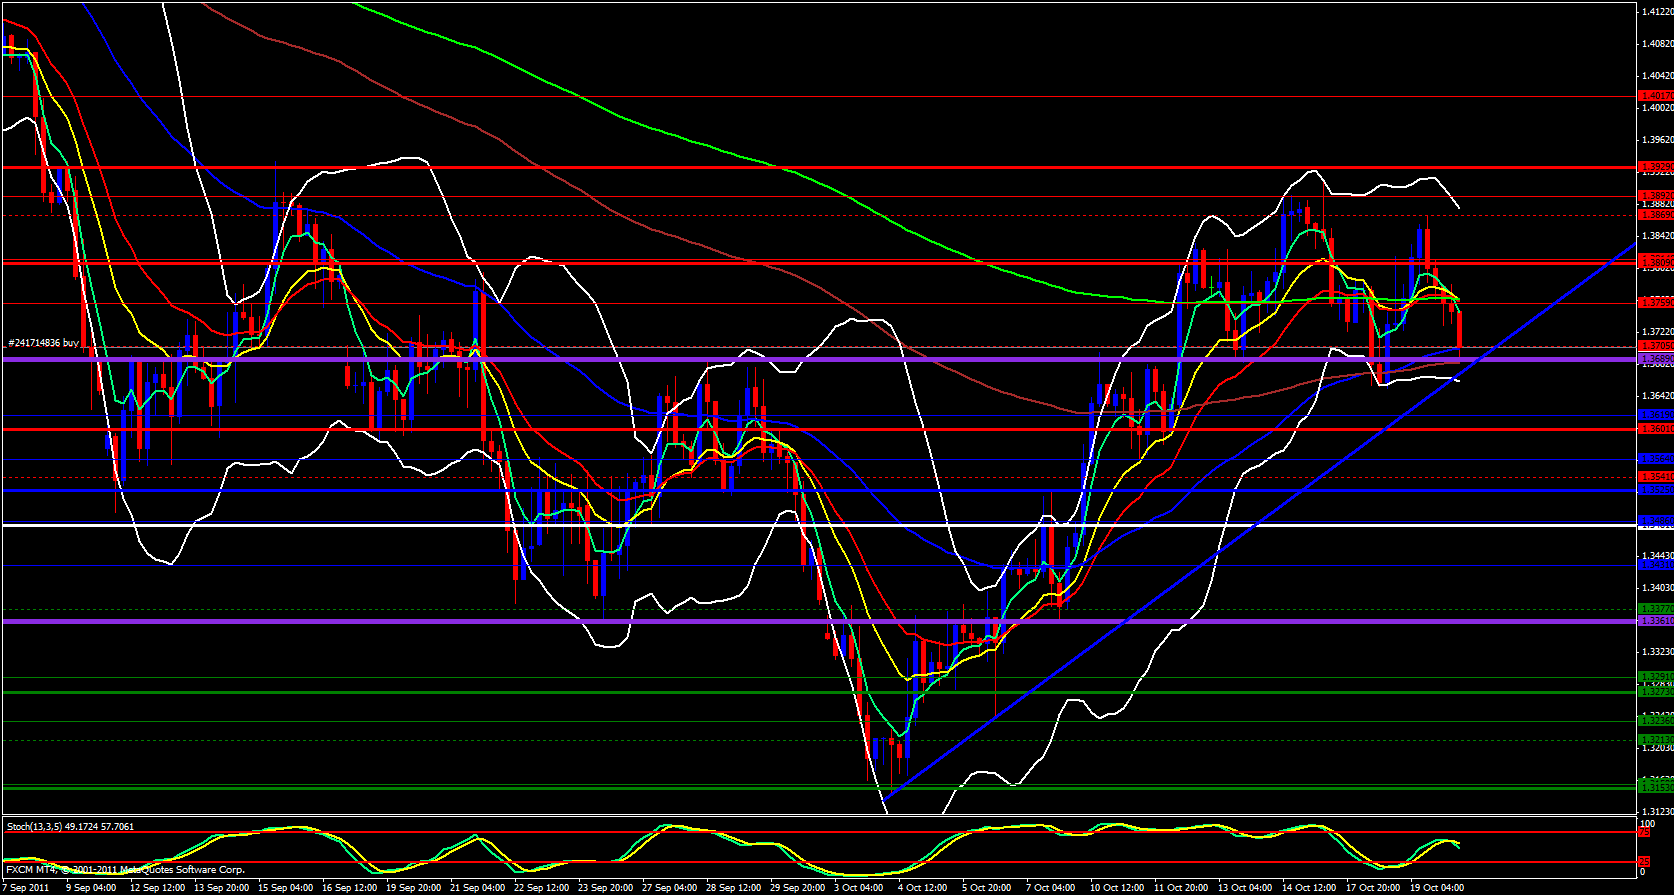
Moving on to the 4 hour chart price is sitting on a very strong level of support, the last months high, 4 hour 55 and 144 ema's as well as a support trend line, however, the stochastic is in the trade zone pointing down and the 5 ema is crossing below the 21 and 13 and looks to be falling. Price will more than likely bounce off of support, meet up with the 5 ema and continue down.
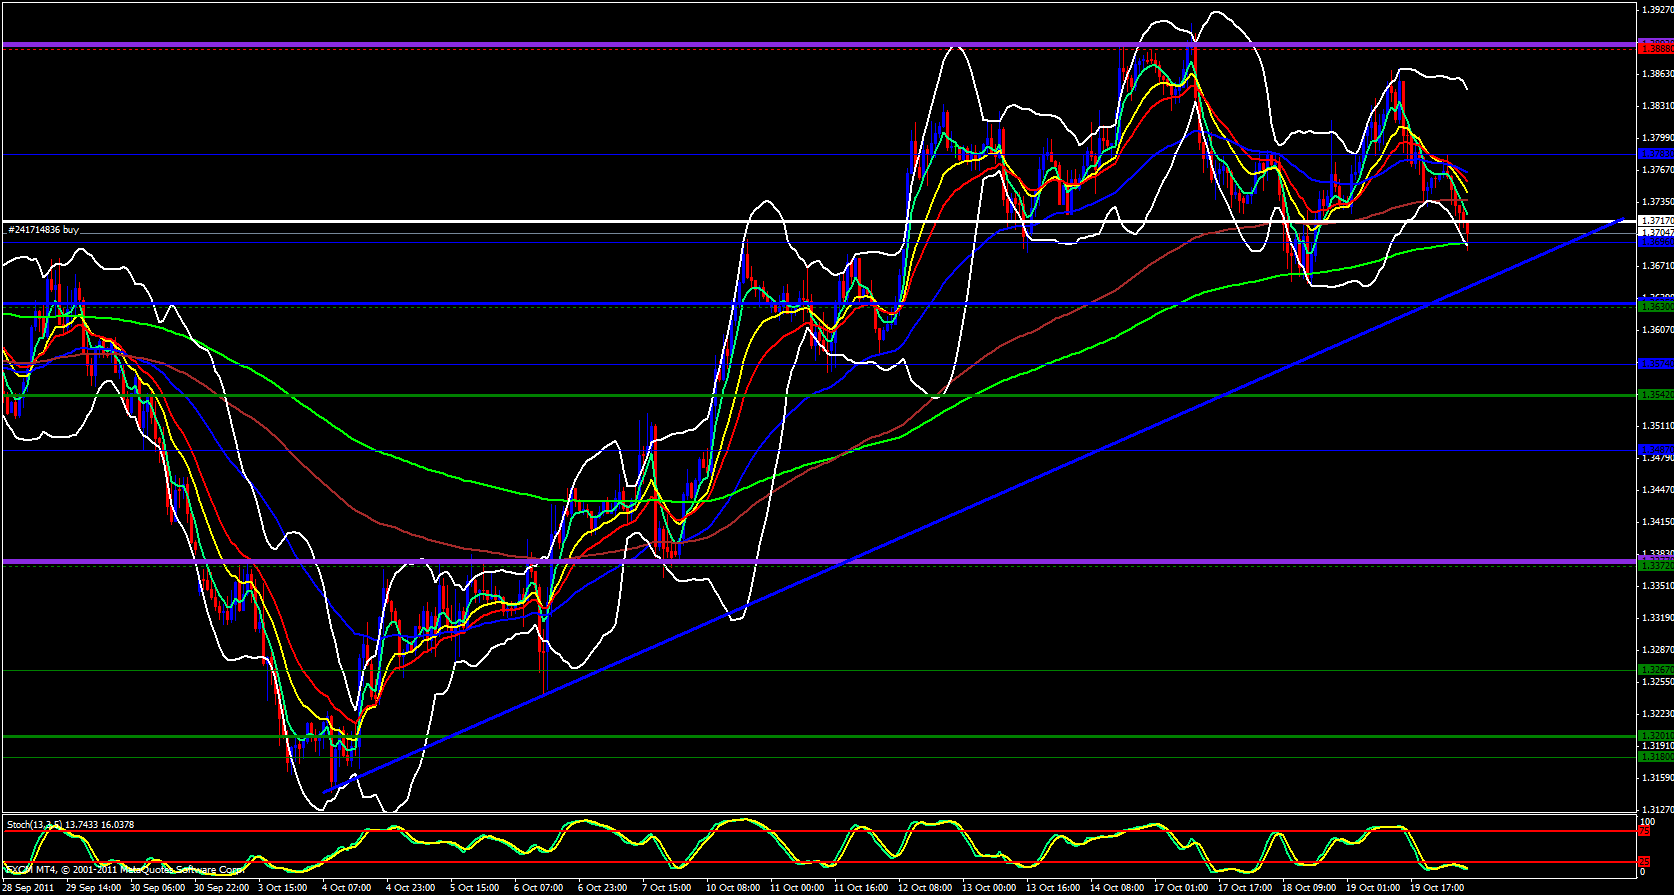
On the hourly chart I see that we have broken through the weekly central pivot point with a lower Bollinger band open and pointing down but price just landed on the 233 ema so I will expect a bounce back up to resistance, say maybe to the hourly 5 ema then continuation to the downside.
On the 15 minute chart price is bouncing off the daily S1 which is obviously overlapped with the hourly 233 so a bounce is expected, possibly up to 1.3724 which is yesterdays low and the 15 minute 21 ema then continuation to the downside should be expected.


