By: Doug Rosen
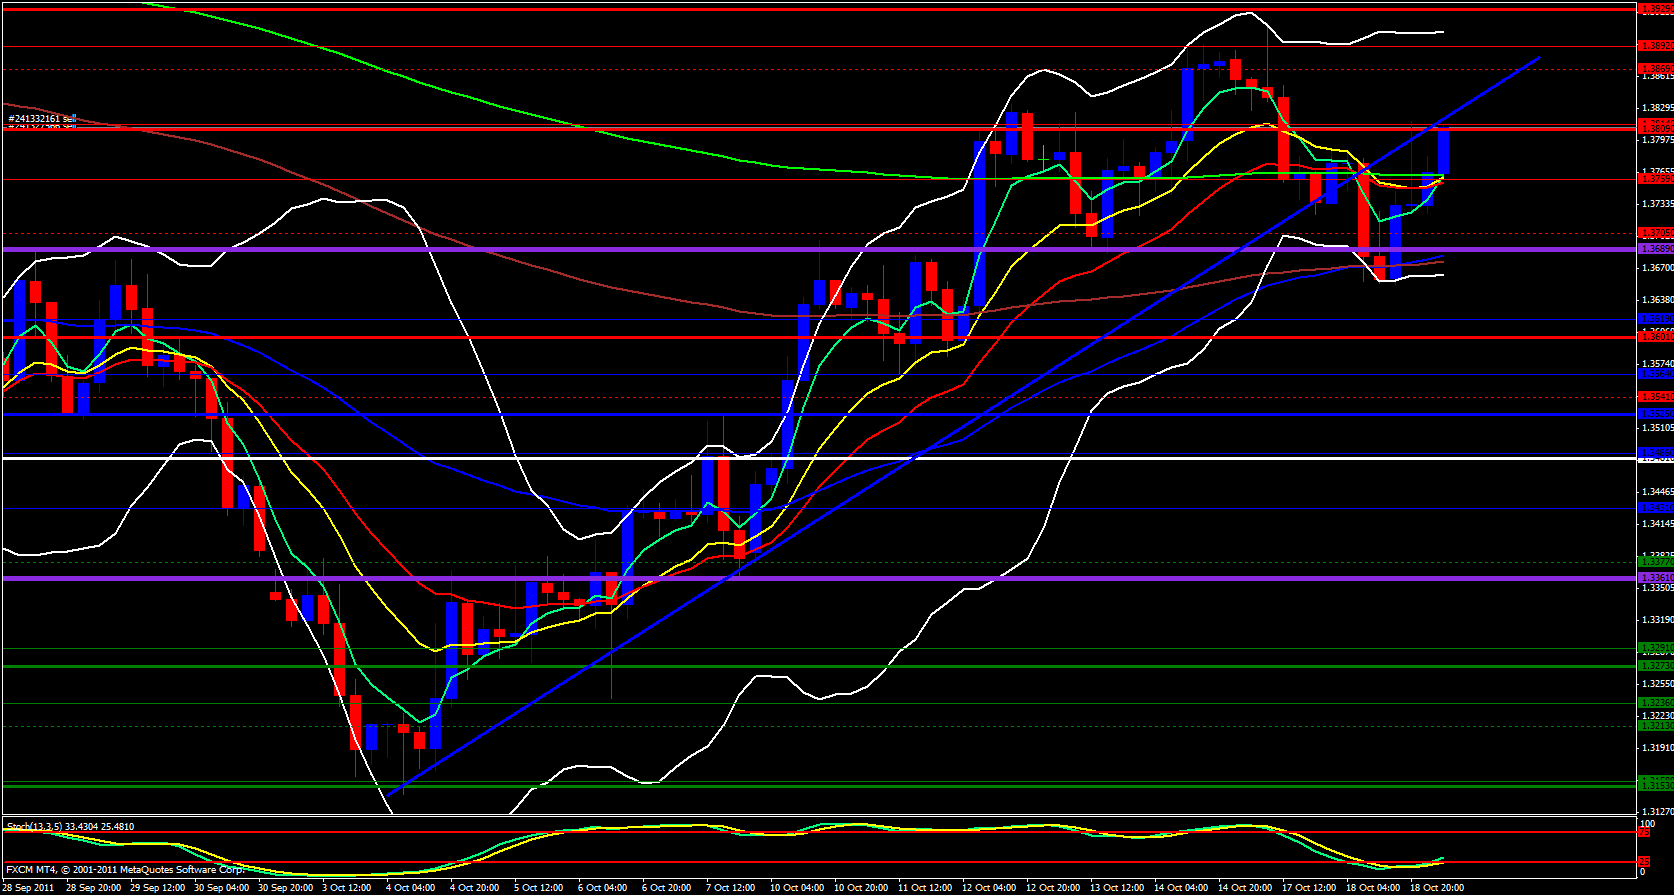
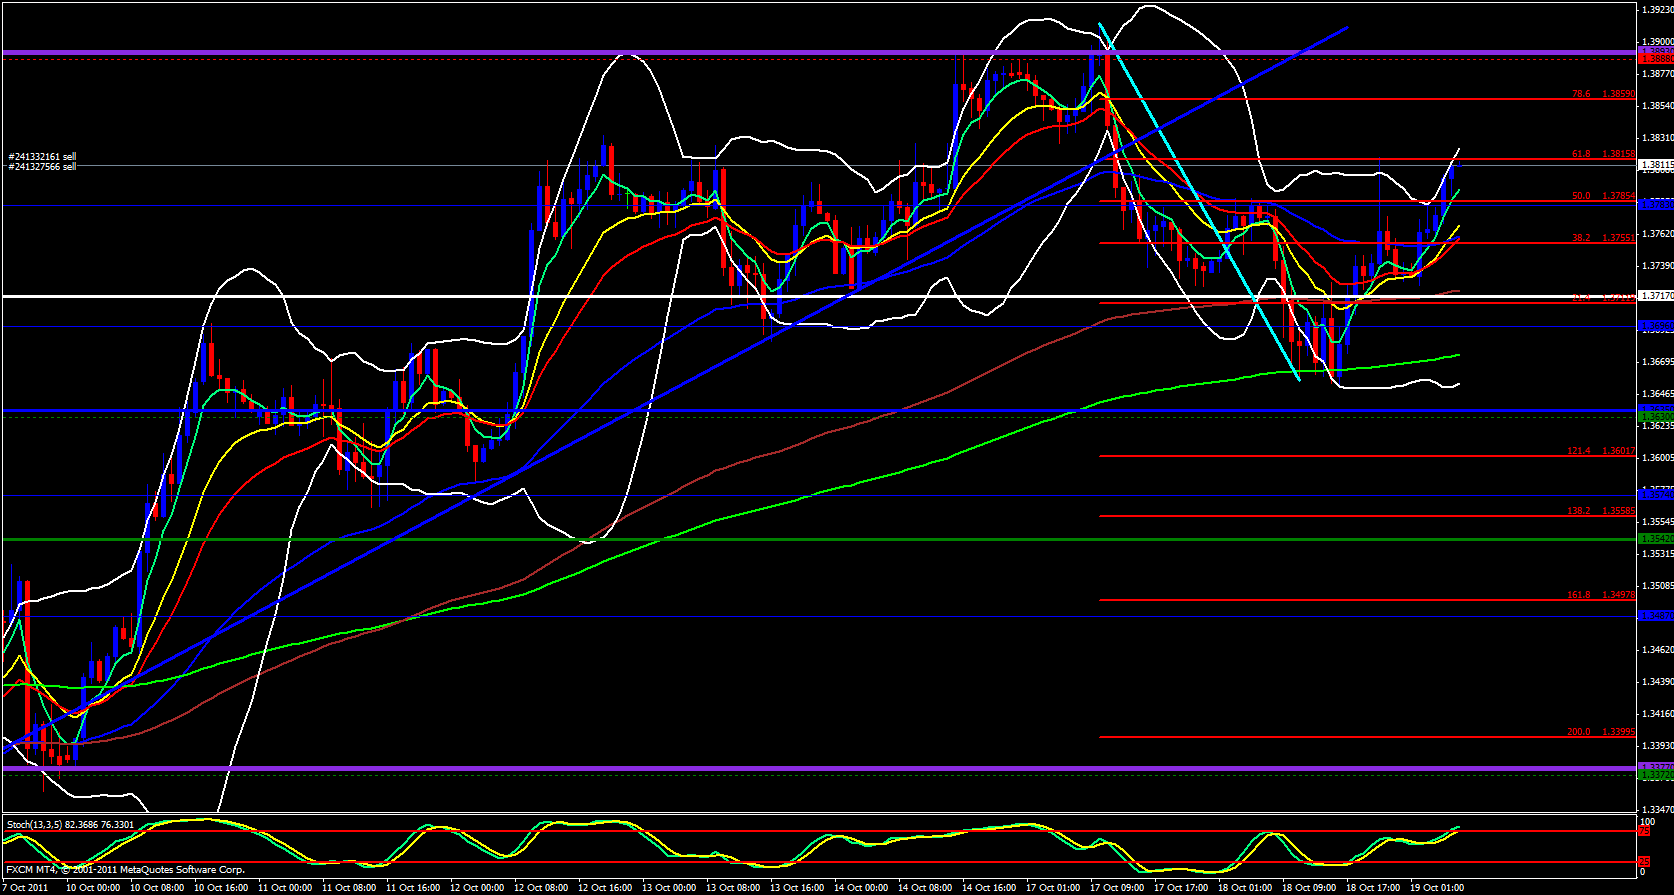
This pair continues to look very bullish, however, this pair is approaching a few layers of resistance that could trigger some profit taking and force price back down a bit. Looking at the daily chart it is obvious that the 50.0 fib of the recent drop is adding a layer of resistance for this pair to contend with as well as the stochastic in the overbought zone. Moving on to the 4 hour chart I do see what appears to be a head & Shoulders pattern and the right shoulder seems to overlap with the monthly R2 Reversal pivot point.
Moving over to the 1 hour chart price has been riding the 5 ema up and the upper Bollinger Band is open and pointing up and price looks so bullish, however, price is at a 61.8 Fib level of the recent swing down which does overlap with the R2 Monthly Pivot.
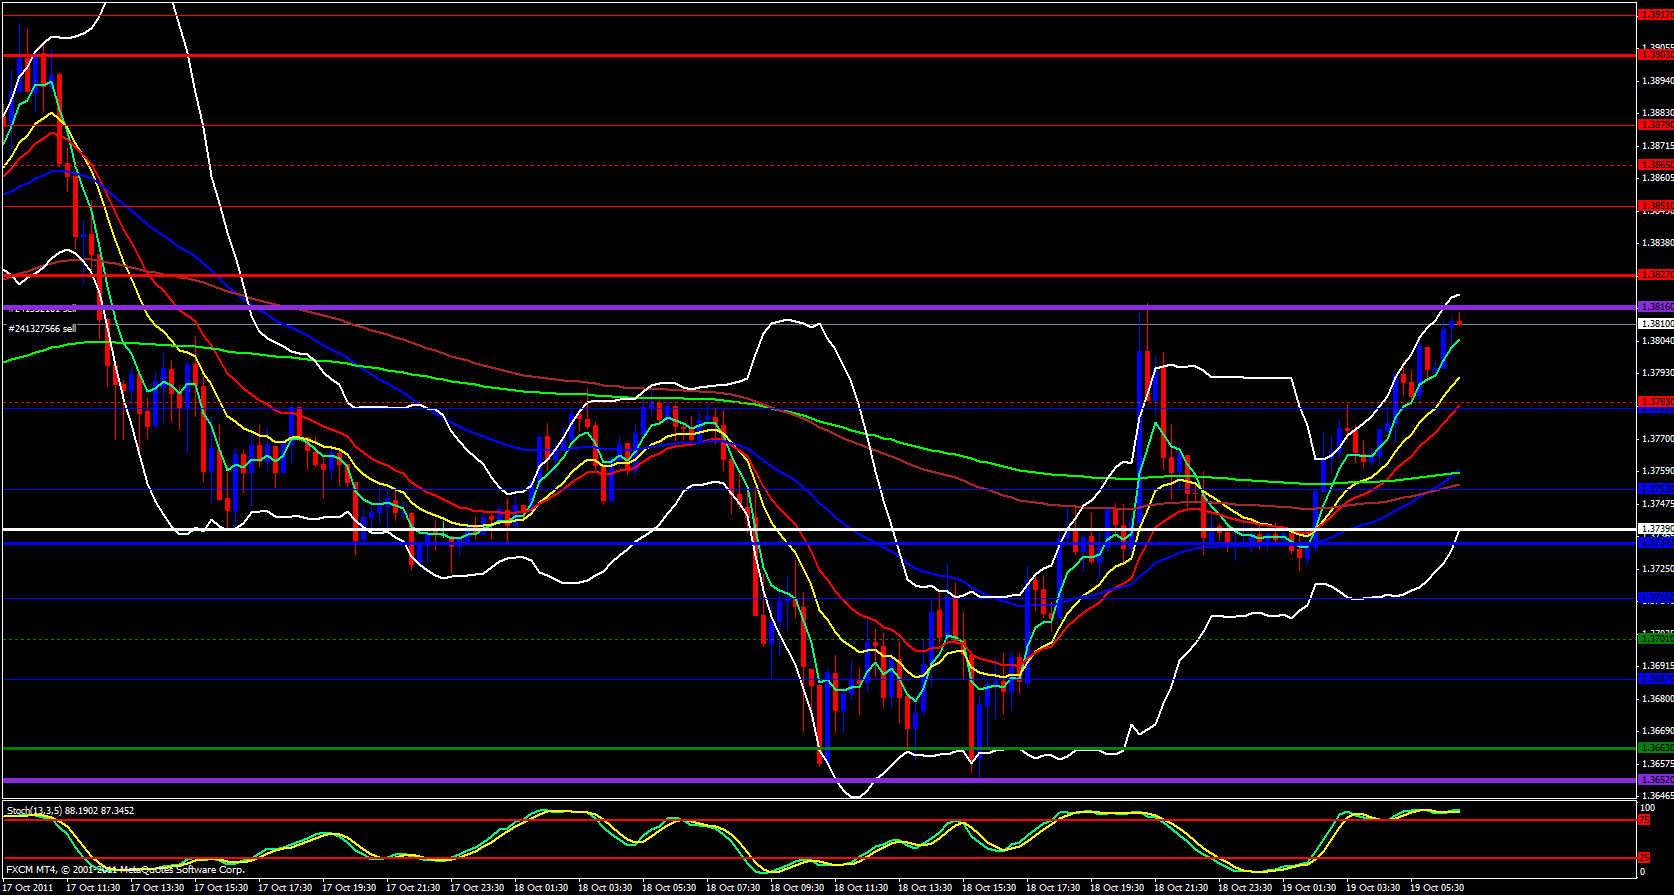
Finally, looking at the 15 minute chart price has been riding the 5 ema up nice and strong, however, it has come up to yesterdays high just under 1.3816 which overlaps with the monthly R2 a well as the 38.2 Fib level I just mentioned. Today's R1 is just 11 pips above yesterdays high and as bullish as this pair is and it is very bullish I do expect profit taking to occur around this level which should force price down a bit today.


