By: Doug Rosen
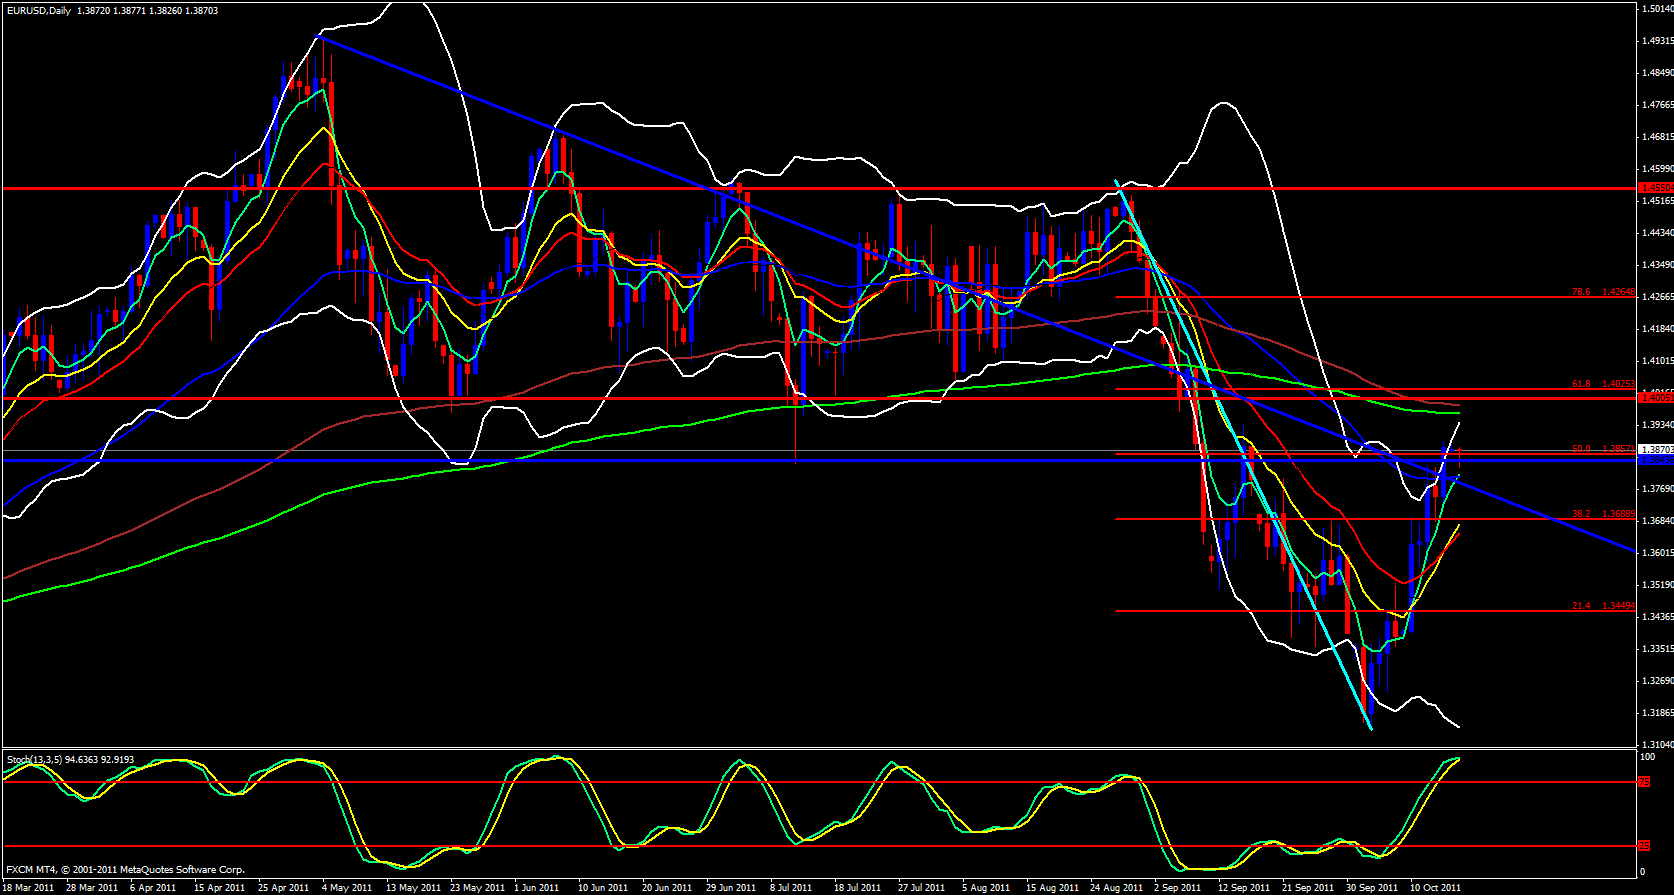
Starting out with the weekly chart I see that this week starts out just below the descending trend line and just below the 13 and 55 ema which have no angle or separation and therefore no power behind them. Since the stochastics is in the oversold zone and the 5 ema is below price and moving in on price I detect that price will continue to maintain bullish for this pair. Moving on to the daily chart it is evident that the energy is to the upside and that price is riding the 5 ema upward and gracefully at that. Price is slightly gapped from the ema so a brief slow down could occur but if so will be very brief. Price has hit a 50.0 Fib of the recent move down so this could be a slow down area, price is certainly in a fight zone since at this level we are bound to run into sellers and we must note that the stochastics is in the overbought zone.

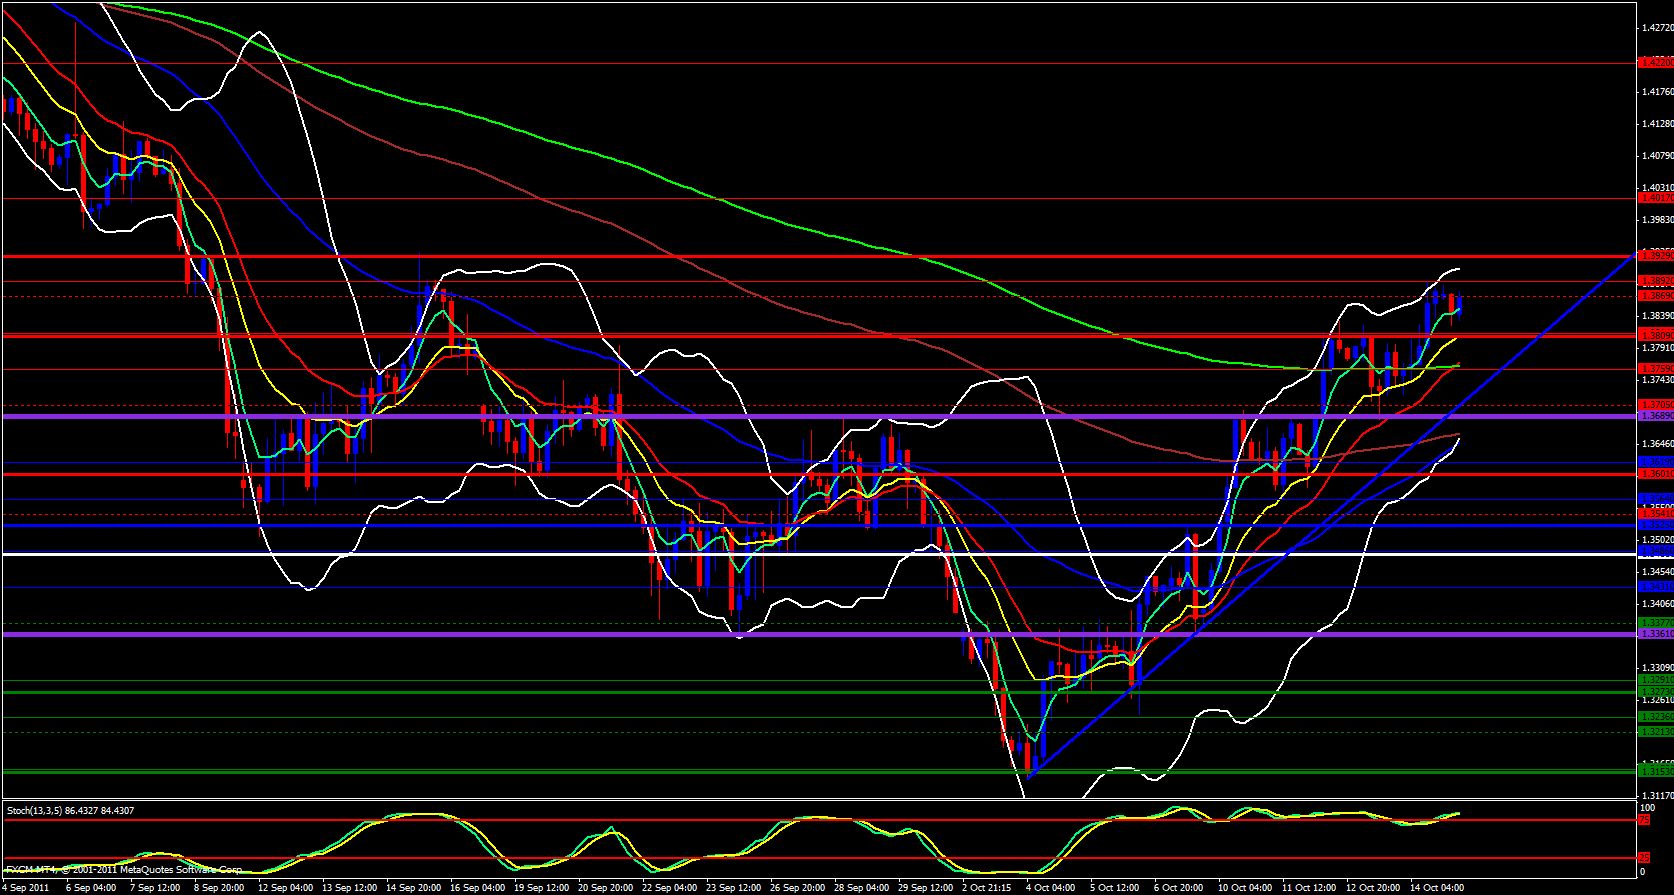
Moving on to the 4 hour chart price is very gracefully riding the 5, 13 and 21 ema's. Price is however approaching the monthly R3 pivot point which does overlap with the fib I just mentioned I definitely expect some fight but if the R3 is broken, this could constitute a break out and price could keep going on and on and on. As bullish as it is, with all things considered, I think a pullback is in order for price to continue its way up.
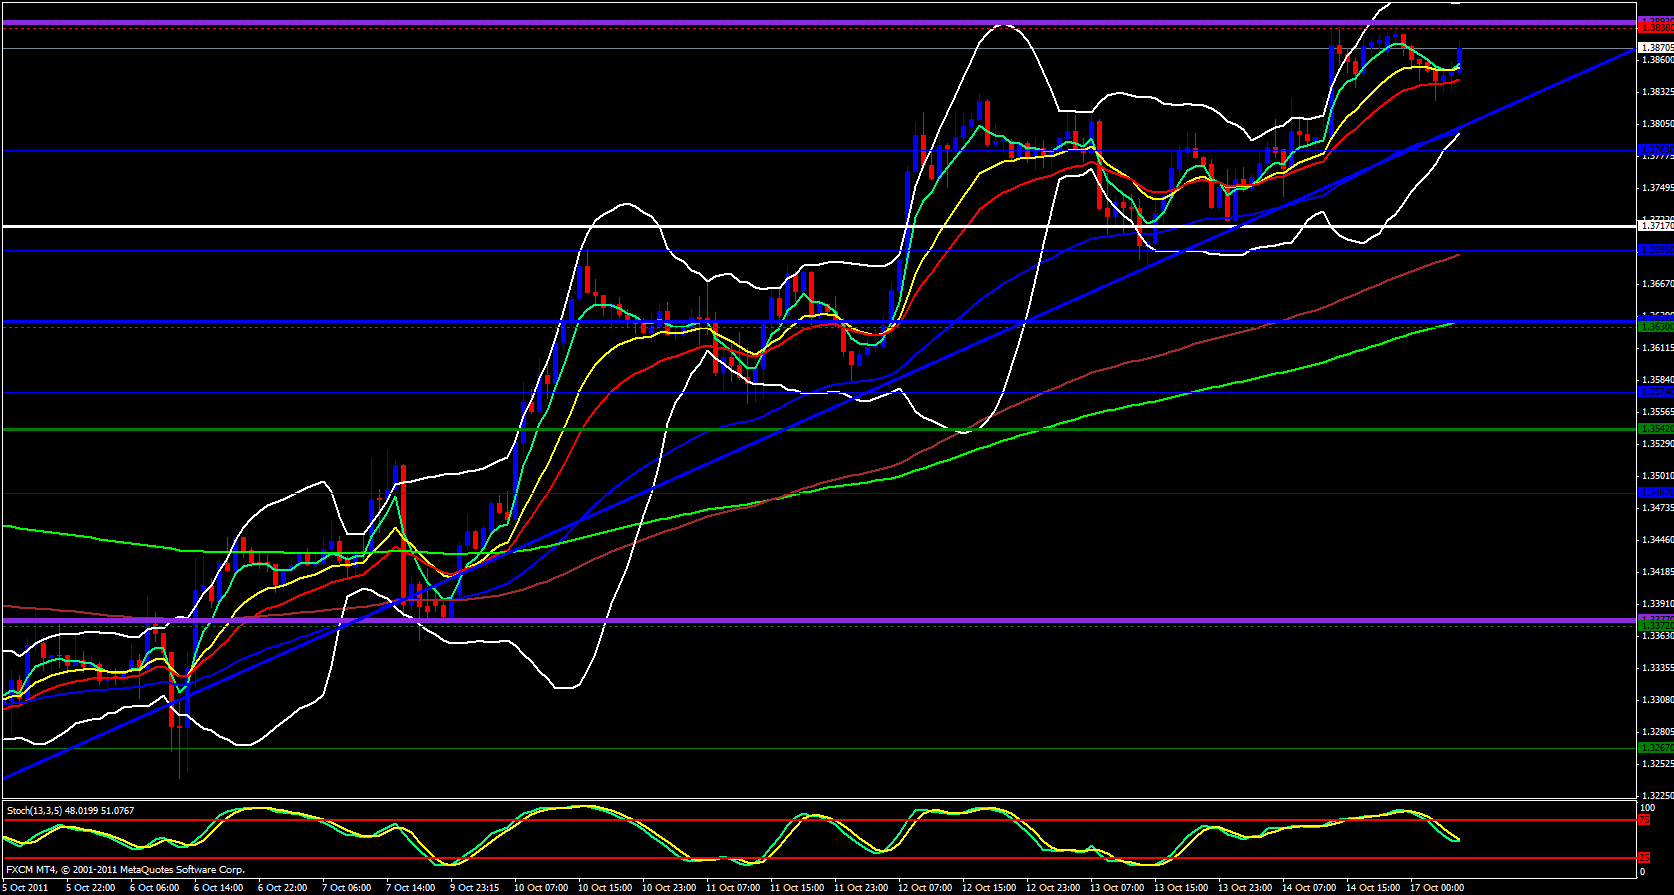
Moving forward to the hourly chart, Price is riding along the 21 ema but approaching last week's high. This coincides with the other areas of resistance I have just mentioned so we must watch for pullbacks. Finally, on the 15 minute chart I see price is stretched out from the upper Bollinger Band and stochastics has entered the overbought zone.


