By: Fadi Steitie
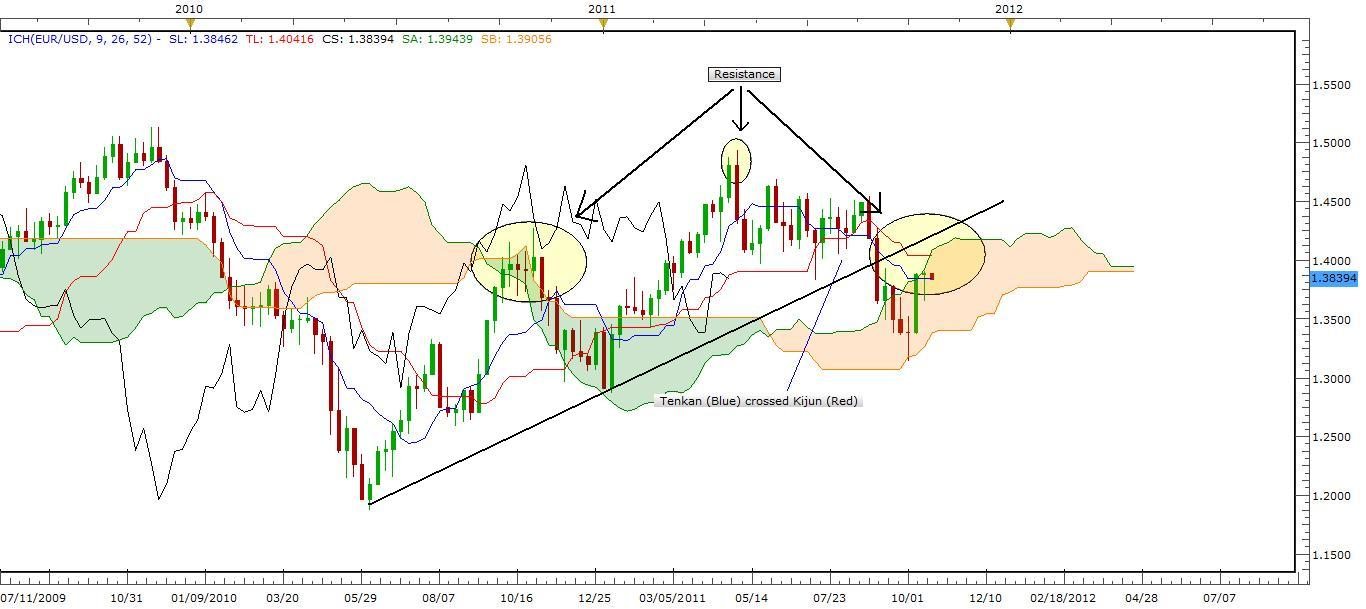
If we take a technical look at the weekly EUR/USD chart using Ichimoku averages, we still notice a negative bias expecting a drop in the trend due to the following reasons:
1- Trend broke the support line.
2- Tenkan (Blue) 9 days crossed Kijun (Red) 26 days on 13 Aug 2011 and trend fell into Kumo (Cloud)
3- Triple Buddha shape (Notice last head is below Kijun-sen (Red)
4- Chikou (Black) past 26 days is pointing toward a major resistance.
I do expect another corrective wave taking the trend down inside Kumo.
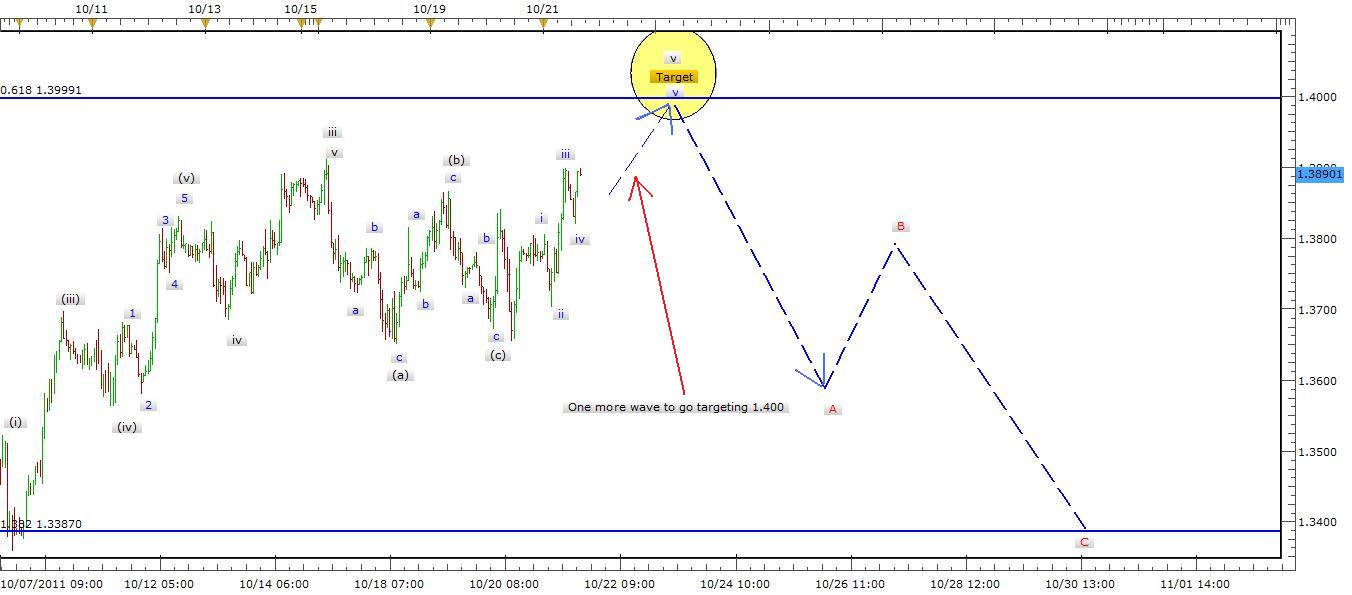
Below, if we take a look at hourly chart using Elliott waves and Fibonacci we can notice the following:
Motive trend is approaching 0.618 Fibonacci level by unfolding the final minor wave v and from here I expect a drop in trend from that point 1.4000 level so I suggest the following trading strategy:
Signal: Sell at or near 1.4000 (I would suggest waiting until a price bounce from that price point).
Strategy: Elliott Waves
Description: Trend is reaching 0.618 Fib level with a complete wave v which alert to an end of a trend and start of a new corrective wave expecting ZigZag.
Target: I will leave the target open until waves i through iii get the shape.
Stop Loss: 1.4100


