By: Doug Rosen
See how this EUR/CHF technical analysis was implemented on a binary actions platform.
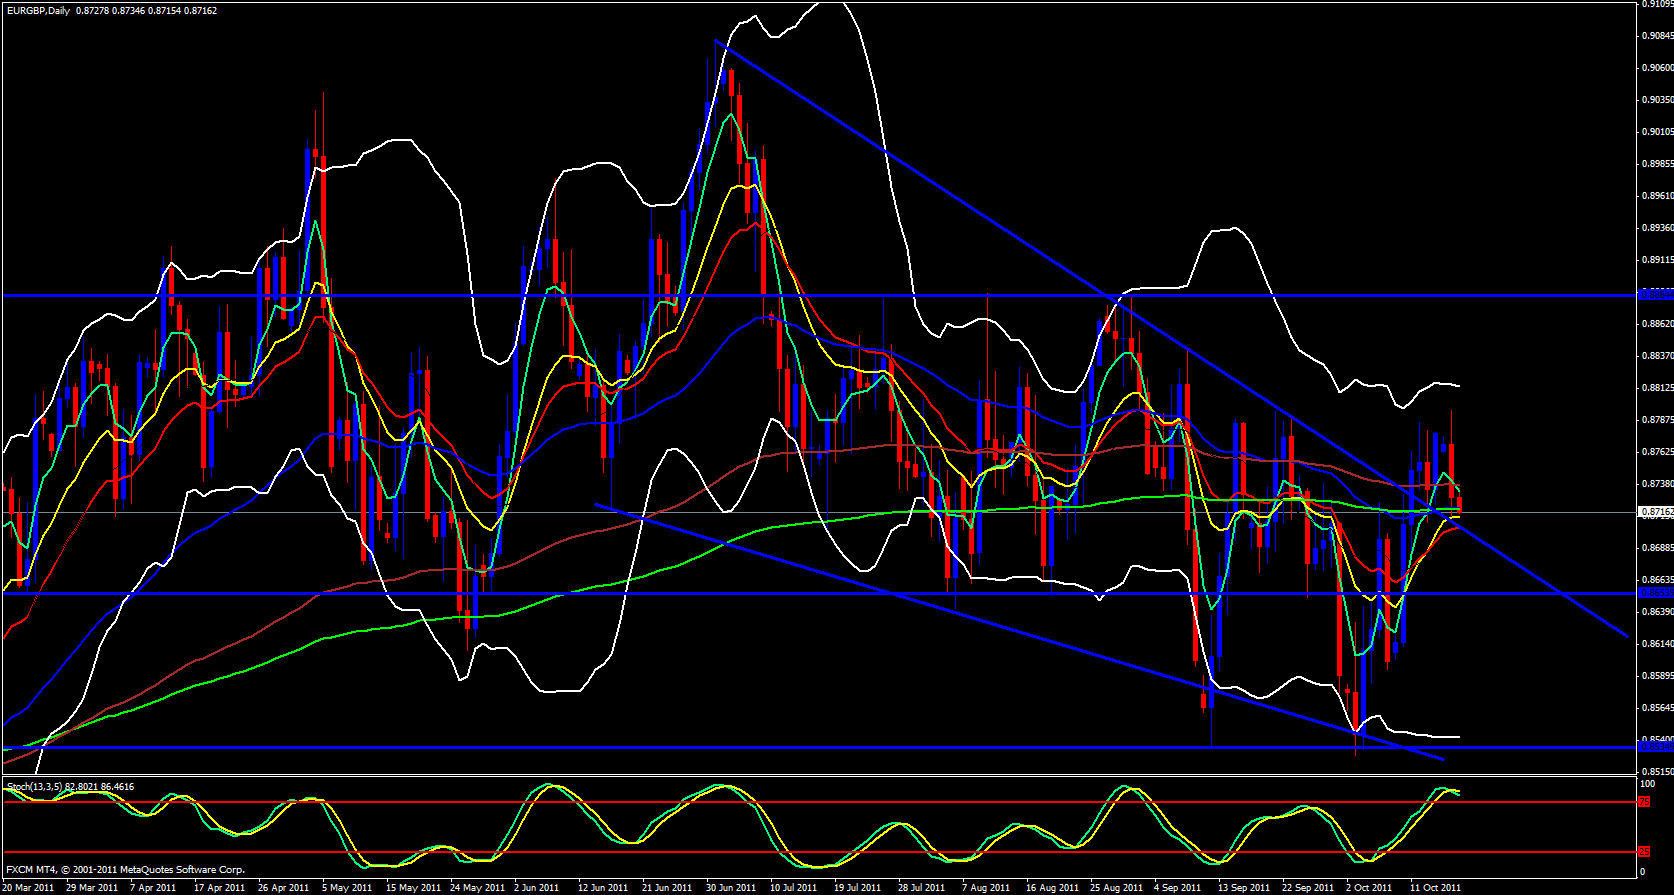
Looks as though the EUR/CHF is struggling to break the descending trend line above it. On the daily chart the 5 ema seems to be rolling over and all the ema's are very close to each other as well as the stochastics in the overbought zone. Price is obviously stalling out a bit. On the 4 hour chart price action has broken out of a price trap and the 5 ema is soon to be crossing out of the trap as well. Looking at the GBP/CHF I am beginning to see some renewed GBP strength. Price seems to be heading up and we even broke above a descending trend line. Looking at the EUR/GBP weekly chart it appears that price has found its way back within its trap. Either this will be a retest or price will keep on dropping. Looking at the daily chart I would normally think this is just a retest but the 5 ema has rolled over and has already crossed below the 144 ema and the stochastics is in the overbought zone.
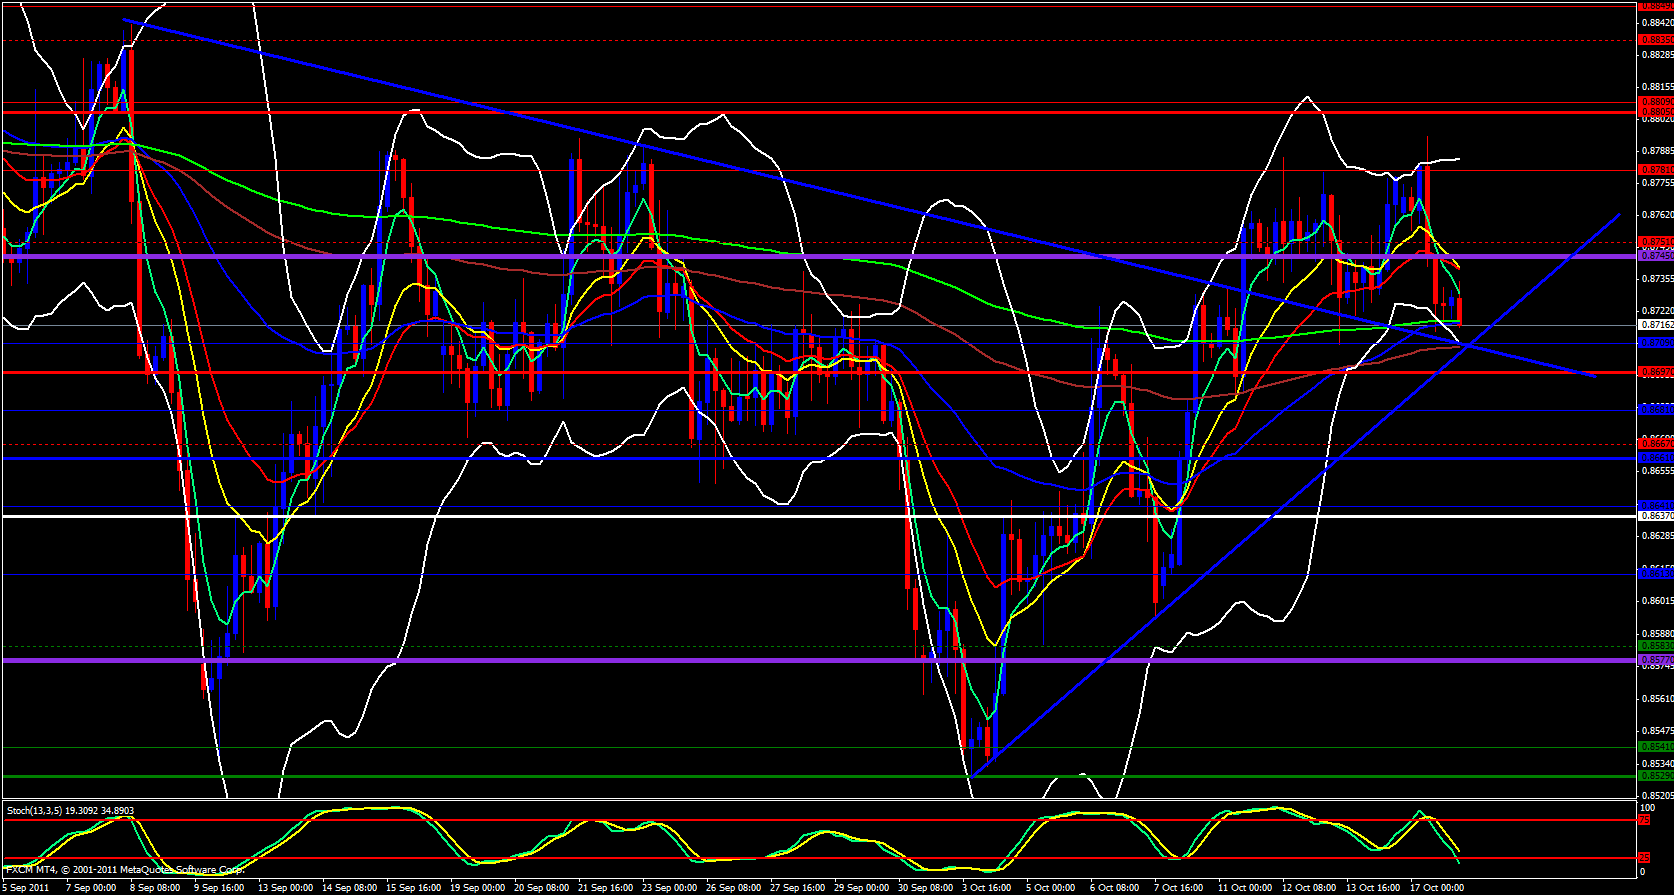
On the 4 hour chart the 5 ema has crossed below the 13 and 21 and pointing straight down and the lower Bollinger band is open and pointing down. We have fallen back down below last months high and this pair is looking heavy to me. Price has fallen below the weekly central pivot point as well and currently battling with the hourly 233 ema just below it.
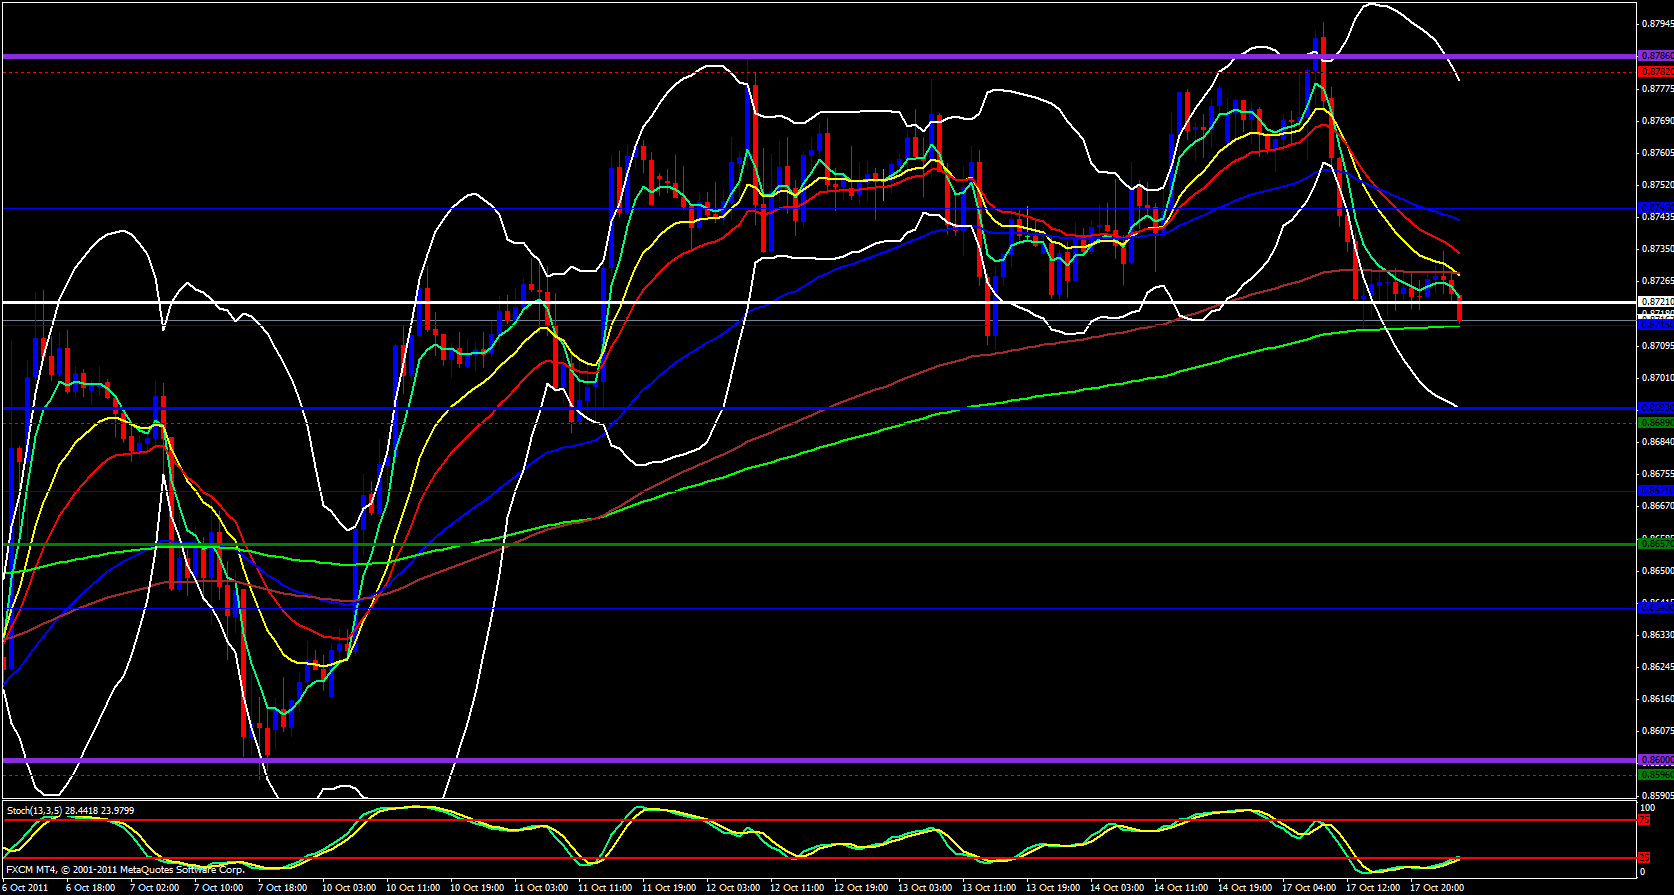
The lower hourly Bollinger band is open and the hourly 5 is pushing price down. At this time the GBP appears to be stronger than the EUR and I am waiting to see price break below 0.8714 and if it does, the next area of support should be around 0.8695 area and if that gets broken we should fall down to 0.8665 area before making a bounce.


