See this GBP/USD technical analysis implemented on a binary options platform.
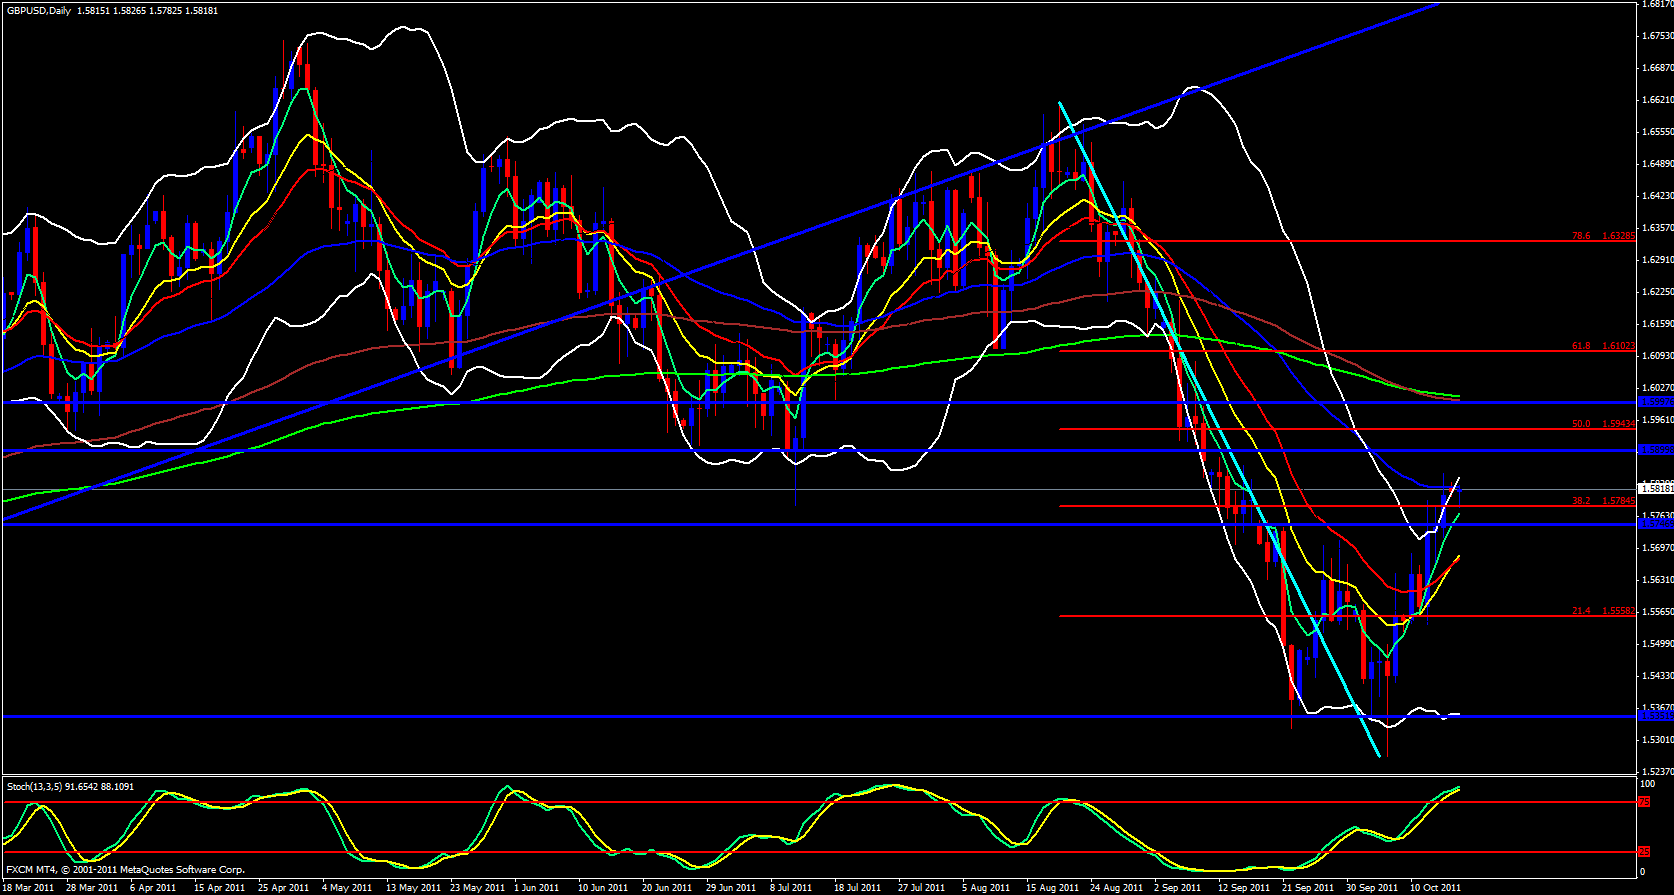
Taking a quick peek at the weekly chart price is in between the 5 and 13 ema. This could cause some range bound action. Moving on to the daily chart price has reached a 38.2 fib zone of the recent move down and up against a 55 ema. Price is a bit gapped from the 5 ema so I believe the fib and 55 will push price down a bit near the 5 ema, not to mention that the stochastics is in the overbought zone. Taking a look at pivot points we are approaching the monthly R2 at 1.5863 just 40 pips away as well as last week's high at 1.5851 and the daily R2 around 1.5857 so we definitely have some very strong resistance overlap between 1.5850 - 1.5865 zone.

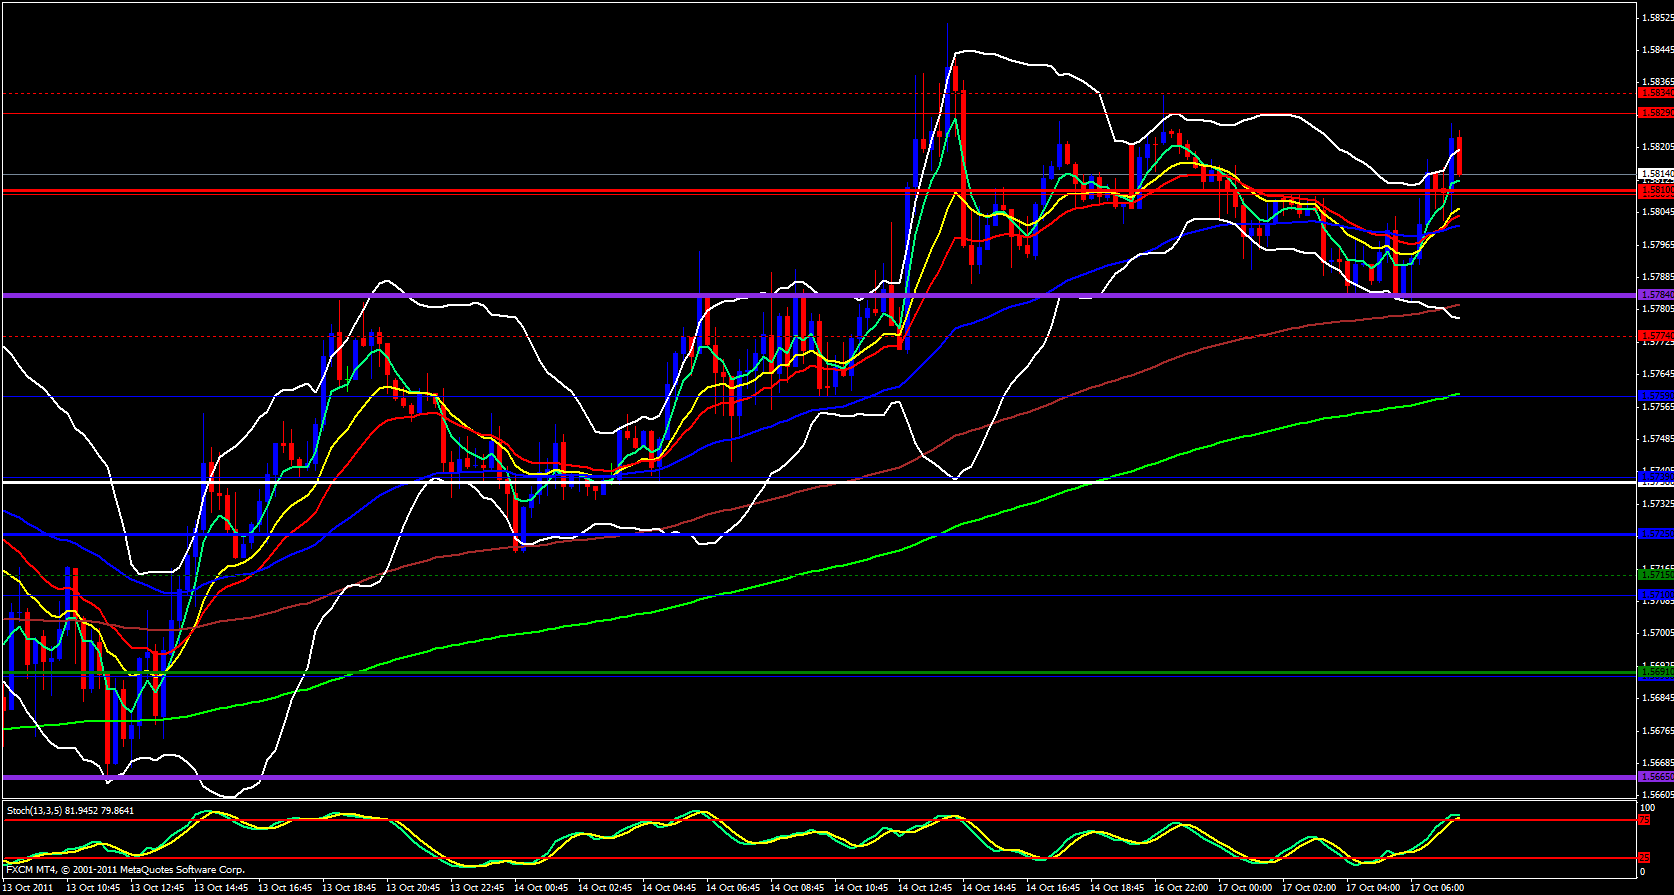
Looking at the 4 hour chart price has been riding the 5 ema but the upper Bollinger band overlaps with the monthly R2 Pivot and the upper band is not open and stochastics is in the overbought zone. The upper band on the hourly is the same. Moving over to the 15 minute chart the upper Bollinger is wide open and pointing up but price is stretched outside the band and I think it needs to snap back down soon and the stochastics is in the overbought zone. So, as bullish as price is, I do see some heavy resistance up ahead and will expect price to pullback around the levels I just mentioned. Remember, correlate this pair with the EUR/GBP as well as the GBP/CHF and read my analysis on the other pairs.


