By: Doug Rosen
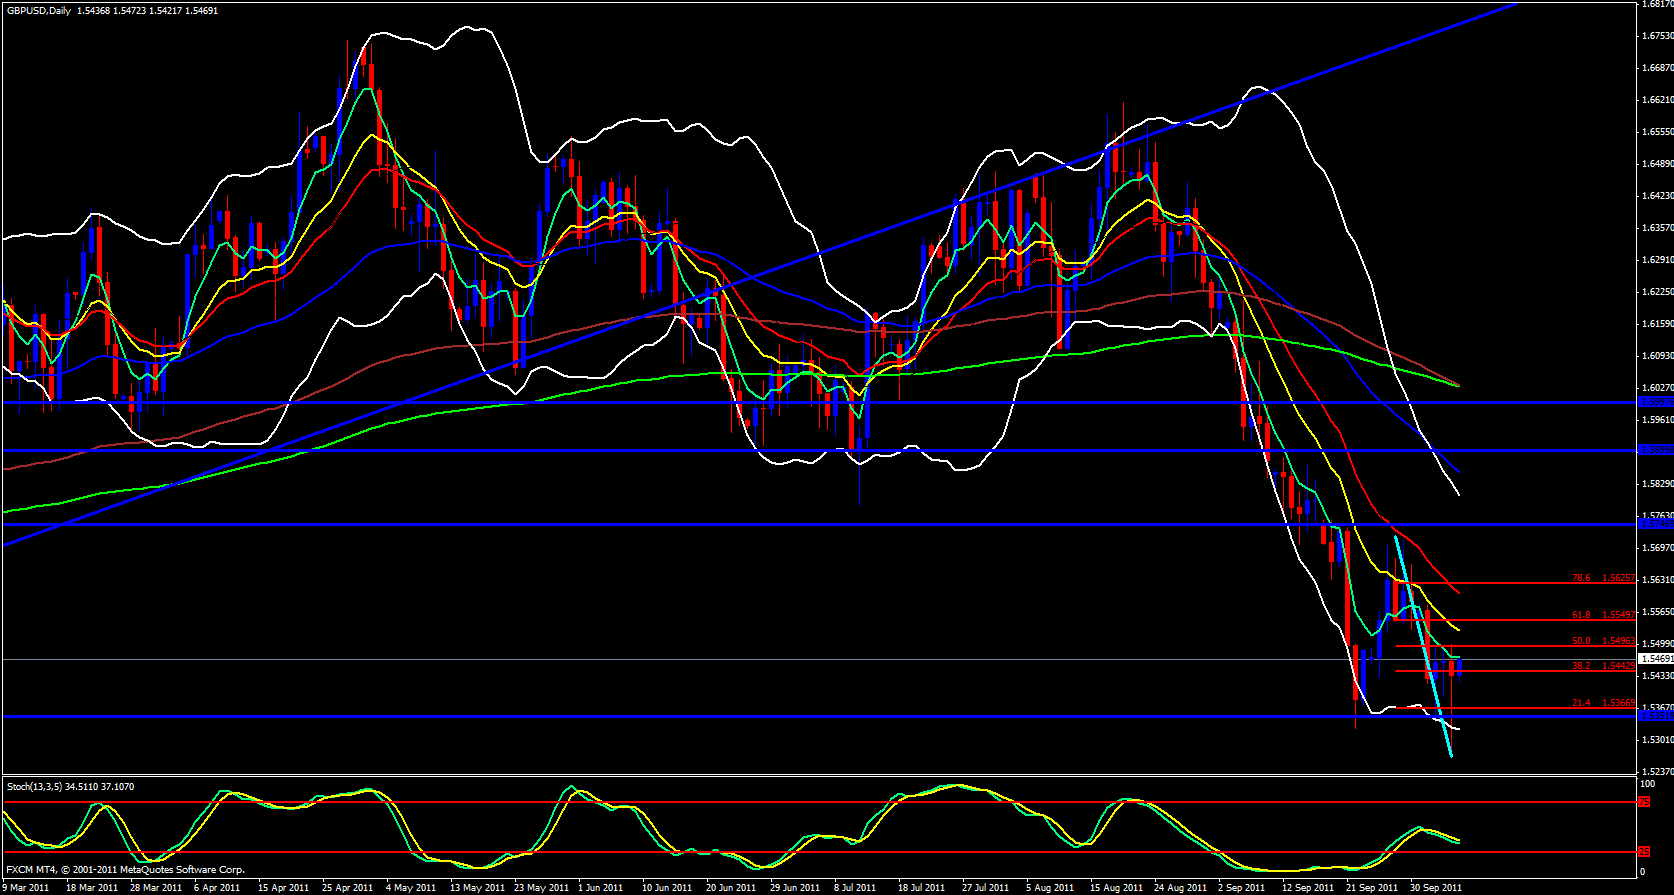
GBP/USD pair is looking as bearish as ever. We recently pierced the support line price has been hovering off of which means there will not be a double bottom.
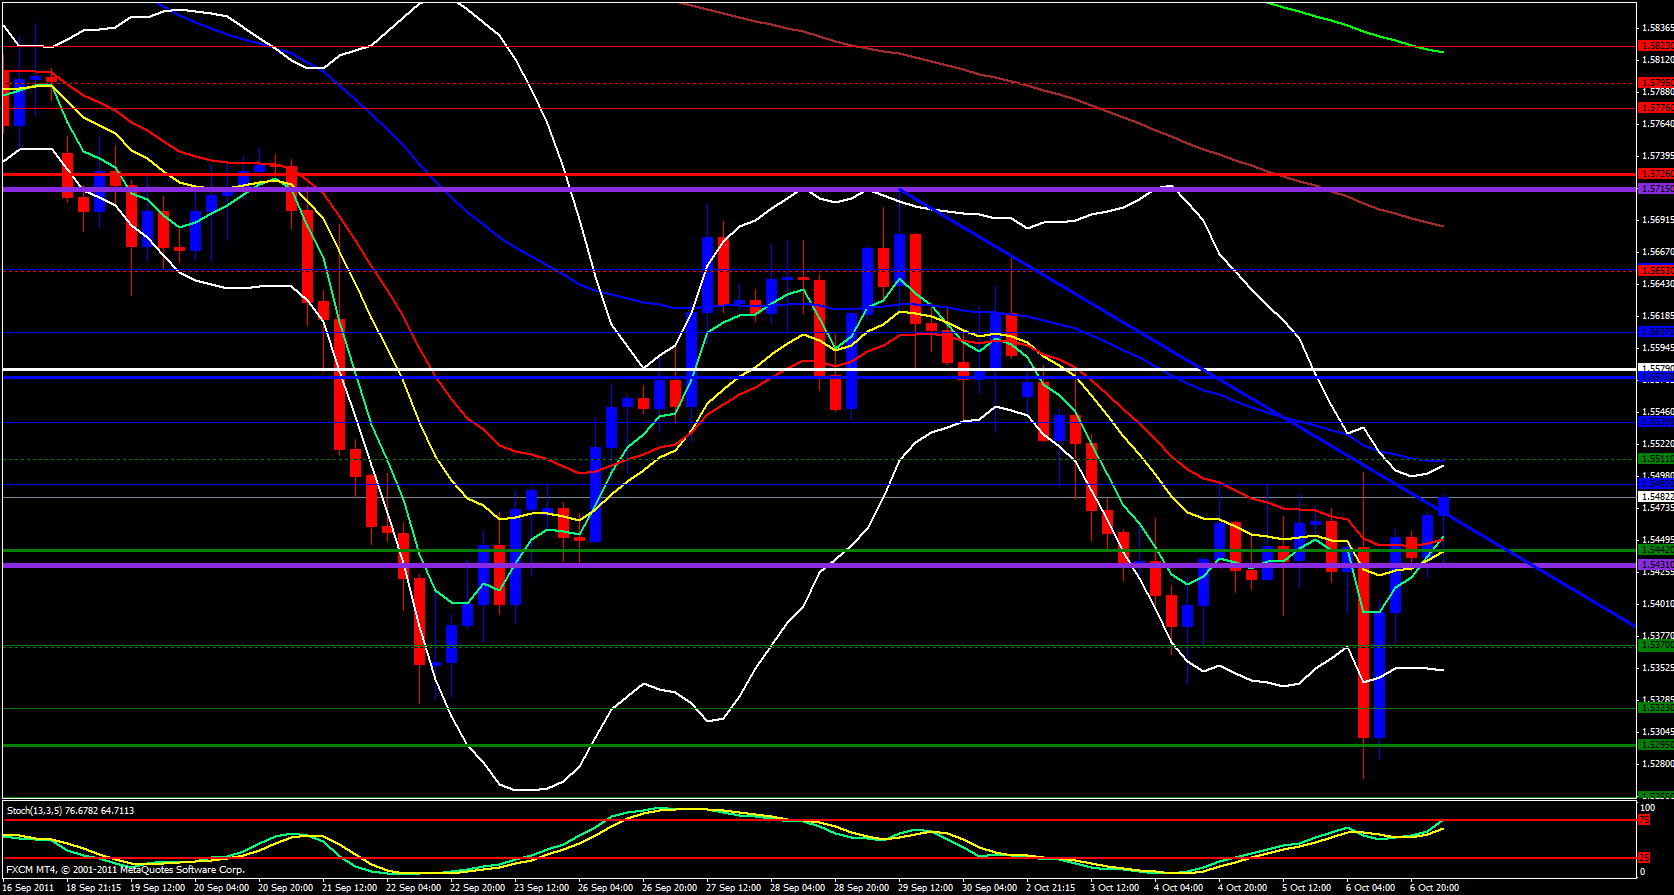
On the daily chart we are approaching the 50.0 Fib level of the recent swing low which overlaps with the daily 233 ema. Now, moving over to the 4 hour chart I see that price is just up against a descending trend line that has been respected a couple times already.
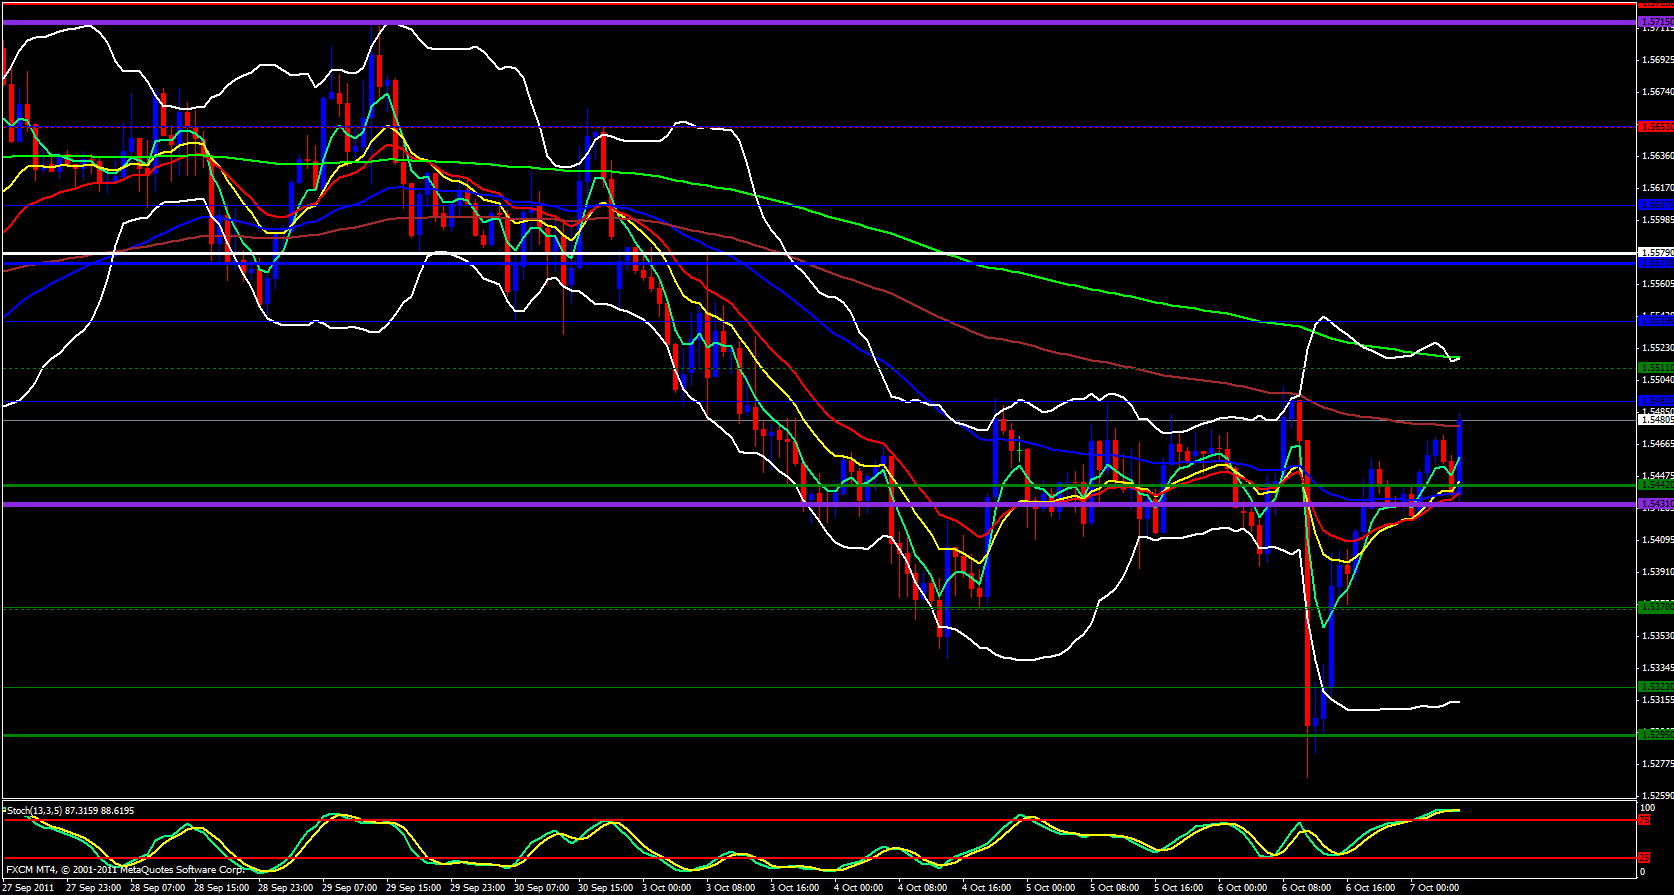
Moving over to the 1 hour chart I see price is up against the 144 ema as well and the
stochastics is in the oversold zone. I also want to point out that price precisely touched the daily M3 and a very strong area of visual resistance. Be cautious while trading this pair today since it is the U.S. Non-Farm Payroll coming up in just a few hours.


