By: Doug Rosen
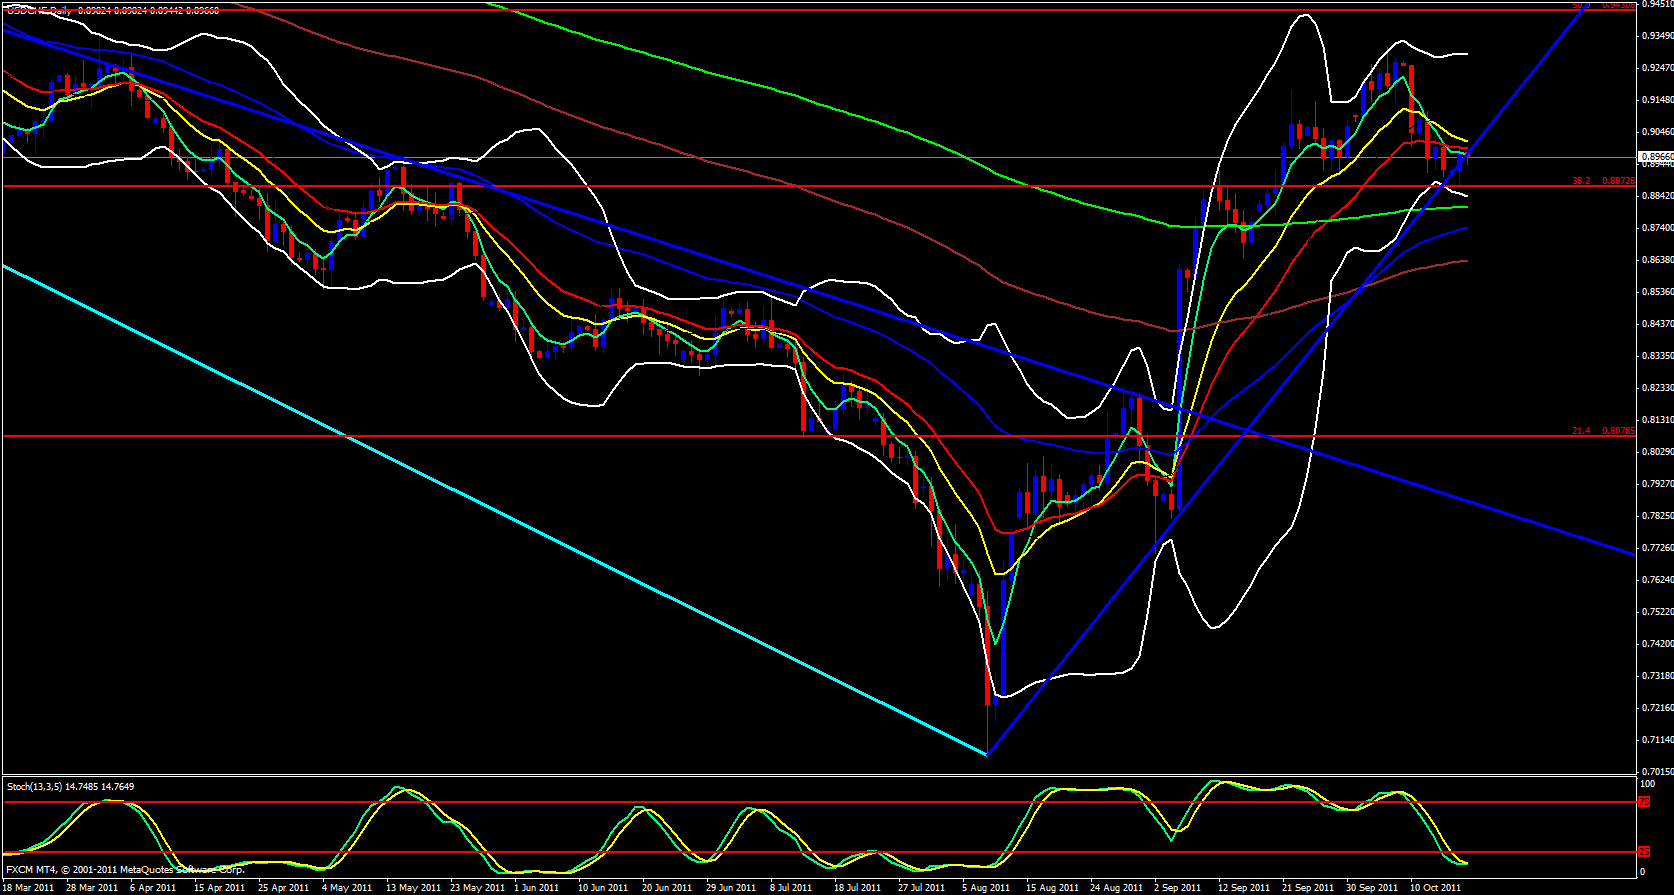
For this pair today I will start out taking a quick look at the weekly chart which has a mixed look to itself. On the weekly, price has been range bound. At this time we are at a 38.2 fib level of the recent move down overlapped with the 13 and 21 ema's above price, however, it looks like price wants to get a ride on the 5 ema. Stochastics is also in the oversold zone crossing up. It's a mixed bag on the weekly. Looking at the daily chart price has reached the 38.2 fib and it is very obvious looking. The 38.2 fib is also overlapped with the 55 ema and the stochastics is in the overbought zone, however, price is riding bullish on the 5 ema and the upper Bollinger band is open and pointing upward, another mixed bag with the daily chart. Price is above last month's high we are above the weekly central pivot point but approaching the weekly M3 reversal pivot point which is just 19 pips below last week's high. At this time, we are above the daily central pivot point.
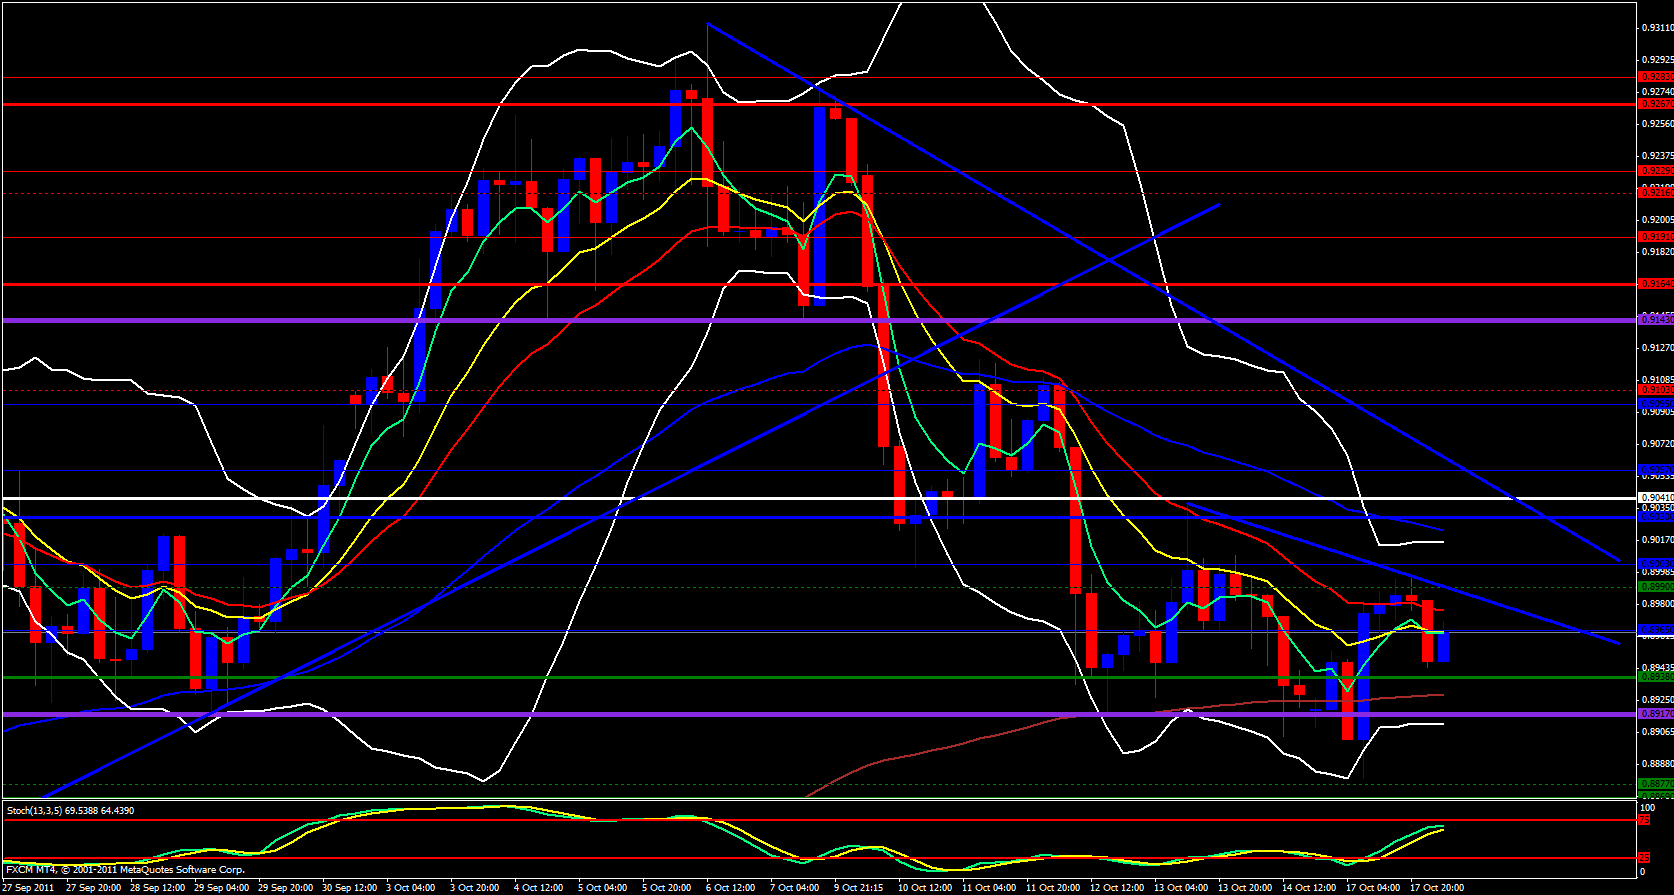
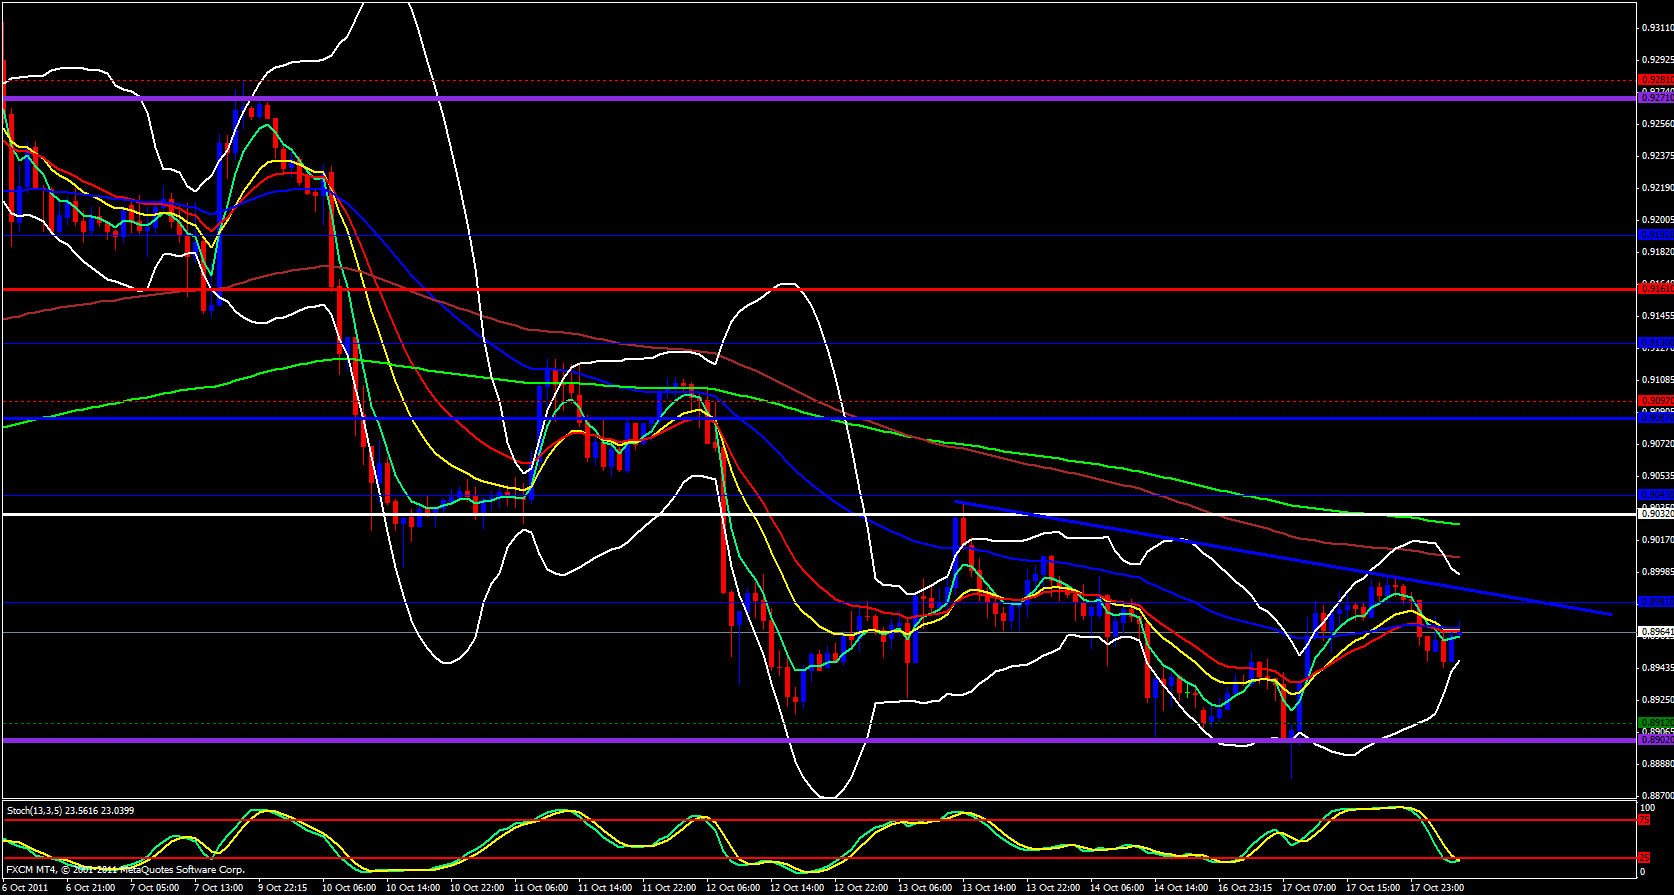
Looking at the 4 hour chart we are slightly above the 233 ema and price is also just above the 5 ema. On the hourly chart price is also riding the 5 ema up, upper Bollinger band is opening to the upside yet stochastics is in the overbought zone. On the 15 minute chart stochastics is crossing down from the overbought zone but price seems to be riding the 13 ema upward. We have busted above the daily M3 pivot, hit the R1, bounced down and have just retested the M3 and seem to be heading back up. Today's read on the GBP/USD is a bit tricky, however, I see GBP strength and a weaker to neutral USD so for this pair I will maintain a bullish bias until proven otherwise.


