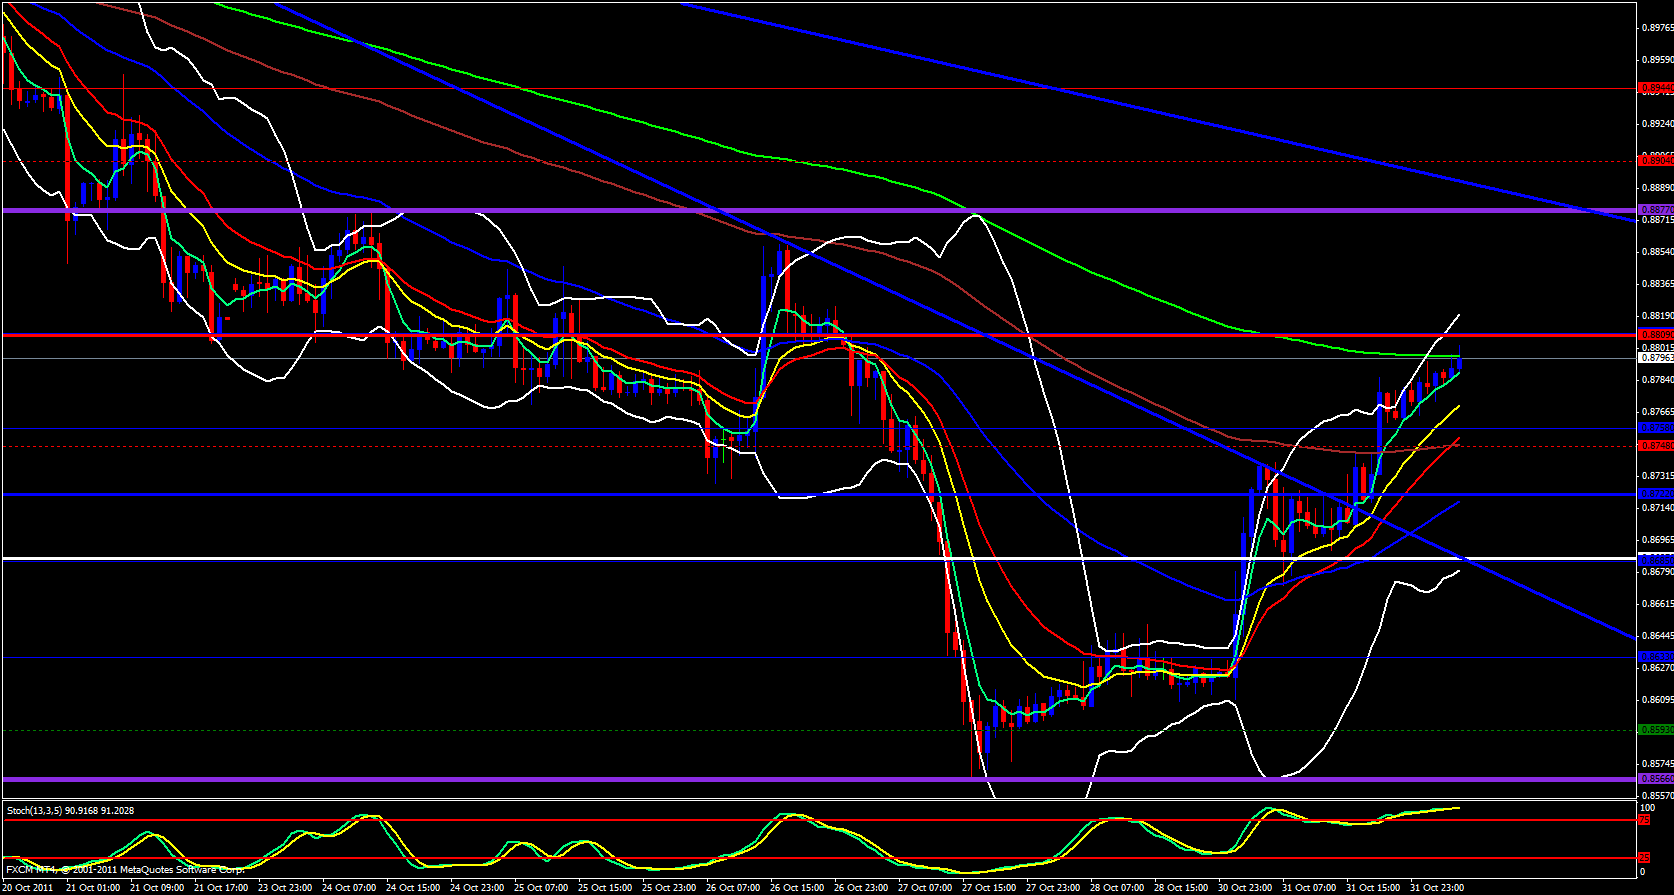
By: Doug Rosen
I will start my analysis for the Swissy with the weekly chart. Price has bounced off the 13 and 21 ema's and is now up against the 5 ema overlapped with the 38.2 fib level. Stochastics is also in the overbought zone.
Moving over to the daily chart it appears we are at a fib level of the recent swing down. This fib level is overlapped with the 233, 13 and 21 ema's. I expect a bearish reaction in this area.
Moving on to the 4 hour monthly pivot chart price is up against the 233 and 55 ema's and the upper Bollinger band is in the same area. The stochastics is also in the overbought zone. The monthly central pivot is at 0.8810 and this area is overlapped with a 38.2 fib of last month's range overlapped with a 144 ema.
Now, moving on to the hourly weekly pivot chart price is still riding the 5 ema gracefully to the upside, however, price is approaching the weekly R1 at 0.8809 and is also currently reacting off the 233 ema and the stochastics is on the overbought zone so a bearish reaction should be expected.
Finally, looking at the 15 minute daily pivot chart it is obvious that price is still riding up the ema's and price has already broken through yesterdays high, however, the daily R1 is at 0.8830 and this time frame also displays a stochastic in the overbought zone. Some type of bearish reaction should be expected somewhere in between 0.8810 - 0.8830.


