By: Doug Rosen
I will begin my analysis for the EUR/GBP today looking at the daily timeframe. On the daily timeframe I can see that price is riding the 5 ema to the downside and on occasion if the 5 ema is breached the 13 ema takes over and forces price back down.
I find that when that happens, usually price stays down for a couple candles before another tap of the 13 ema. So, if price touched the 13 ema yesterday on a daily candle and today the candle is just below the 5 ema then I think price will just drop throughout today.
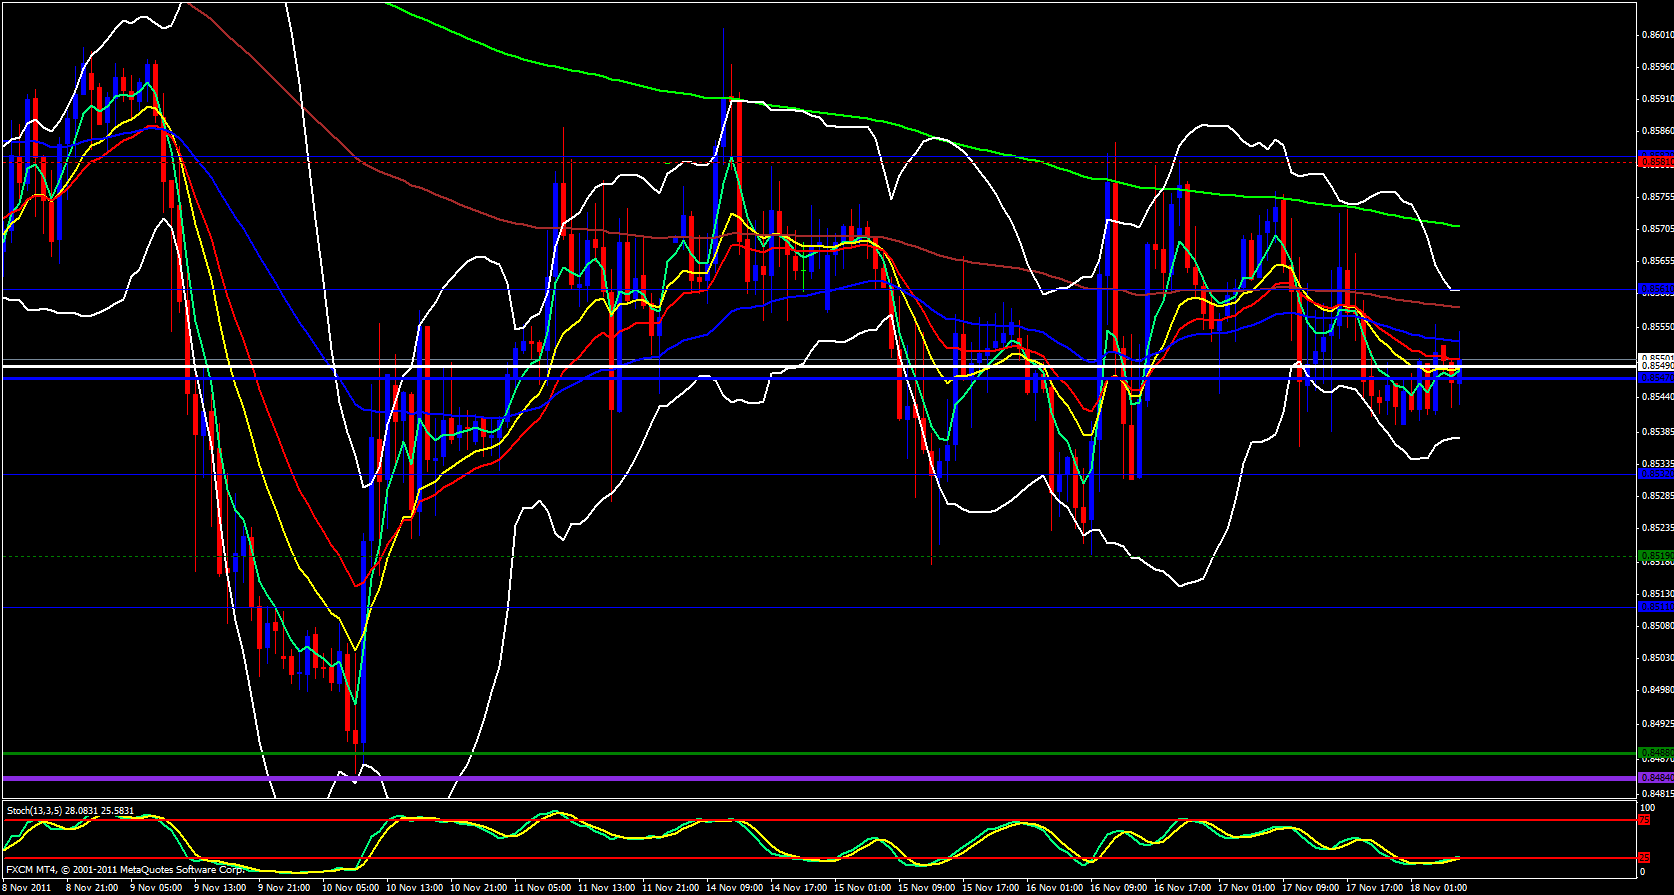
On the 4 hour timeframe price is in a bit of a trap, a sort of apex and price is already within the nose area. This can constitute a break out. The breakout will confirm to me if the daily candle wants to head back up to the 13 ema or just keep falling.
At this time price on the 4 hour chart timeframes is under the ema's however, price is sitting on a support trend line that could be that is pushing price up. If price breaks below, it will find some support at last month's low at .8529 and if broken should fall to .8487 which is the monthly S1.
On the hourly timeframe price is tapping on the 55 ema from below and the 144 is just above the 55 which adds to the above resistance. Price has been hanging around the daily central pivot point at .8551


