By: Doug Rosen
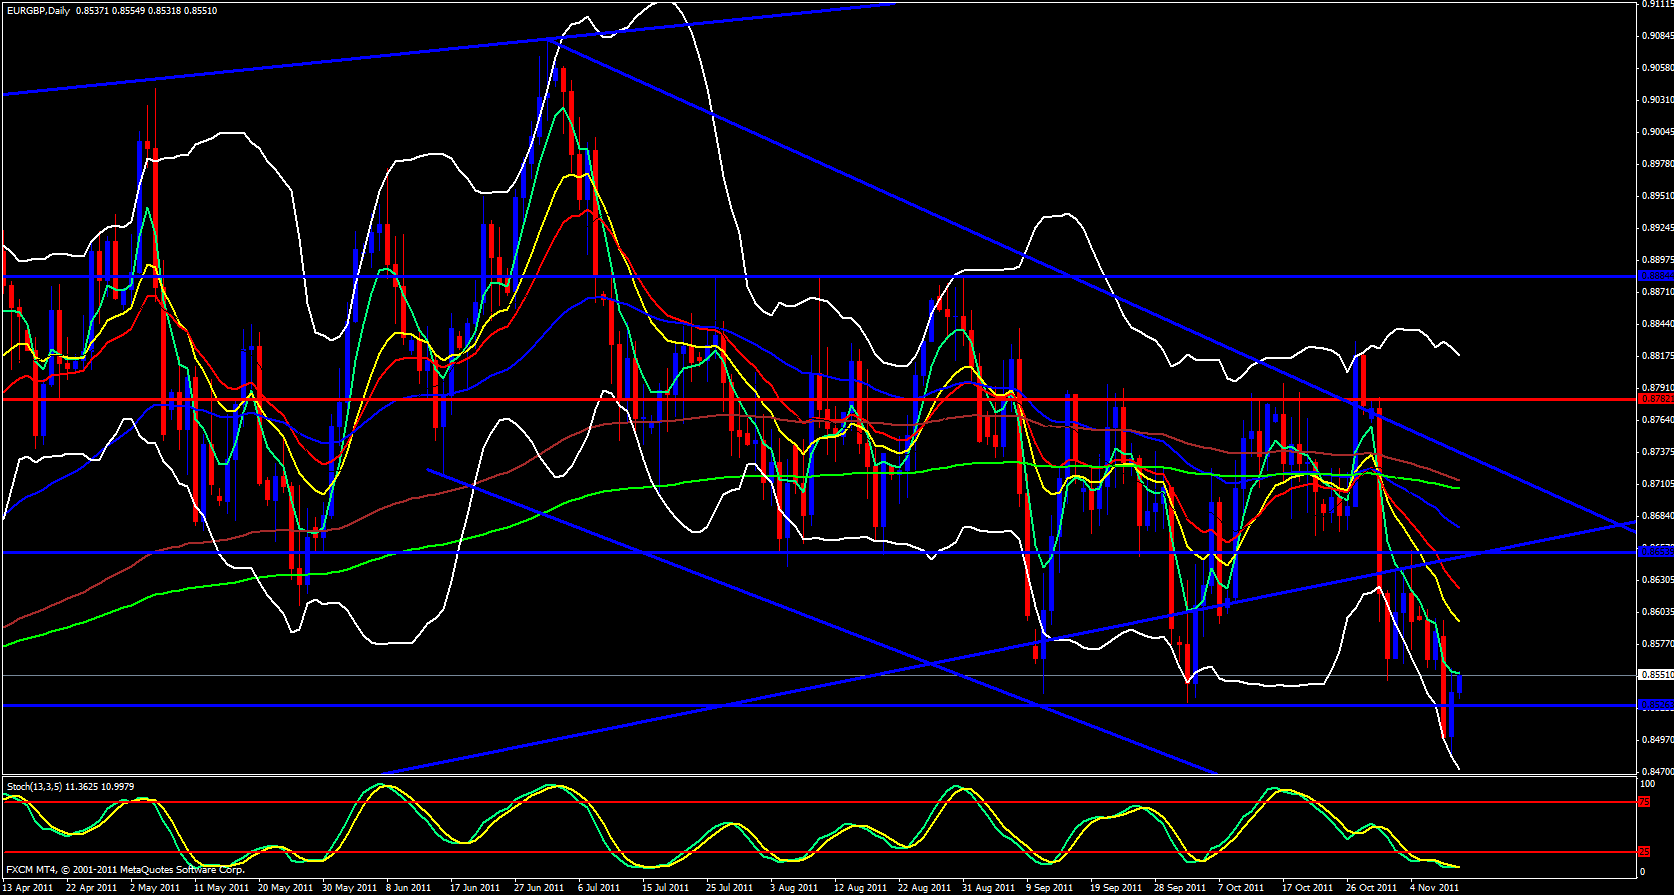
I start my analysis tonight for EUR/GBP pair looking at the daily timeframe. This pair looks very interesting to me today. Price is precisely touching the daily 5 ema and the lower Bollinger band is open and pointing straight down. Price could rise up to the 13 ema you must keep in mind.
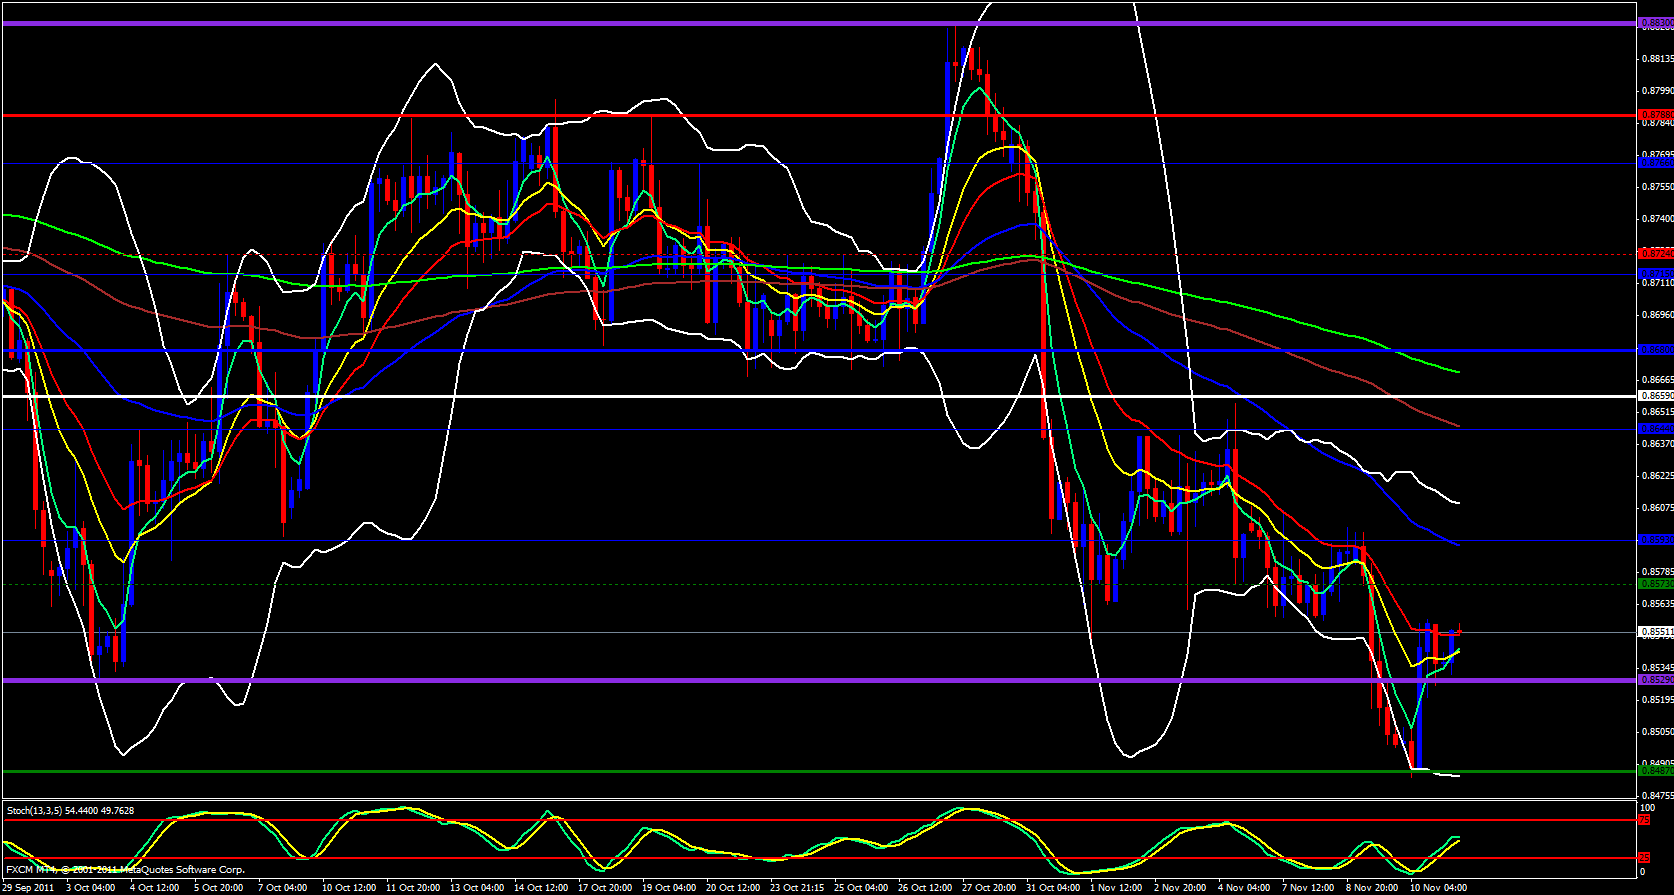
Moving on to the 4 hour timeframe price is up against a sloping resistance line I have drawn and up against a 38.2 fib of the recent swing down.
The upper Bollinger band is opening and pointing up and price has begun to ride up the 5 ema and the stochastics is pointing up.
Price has busted the 21 ema to the upside and the 5 ema is crossing above the 13 ema so price could be heading up.
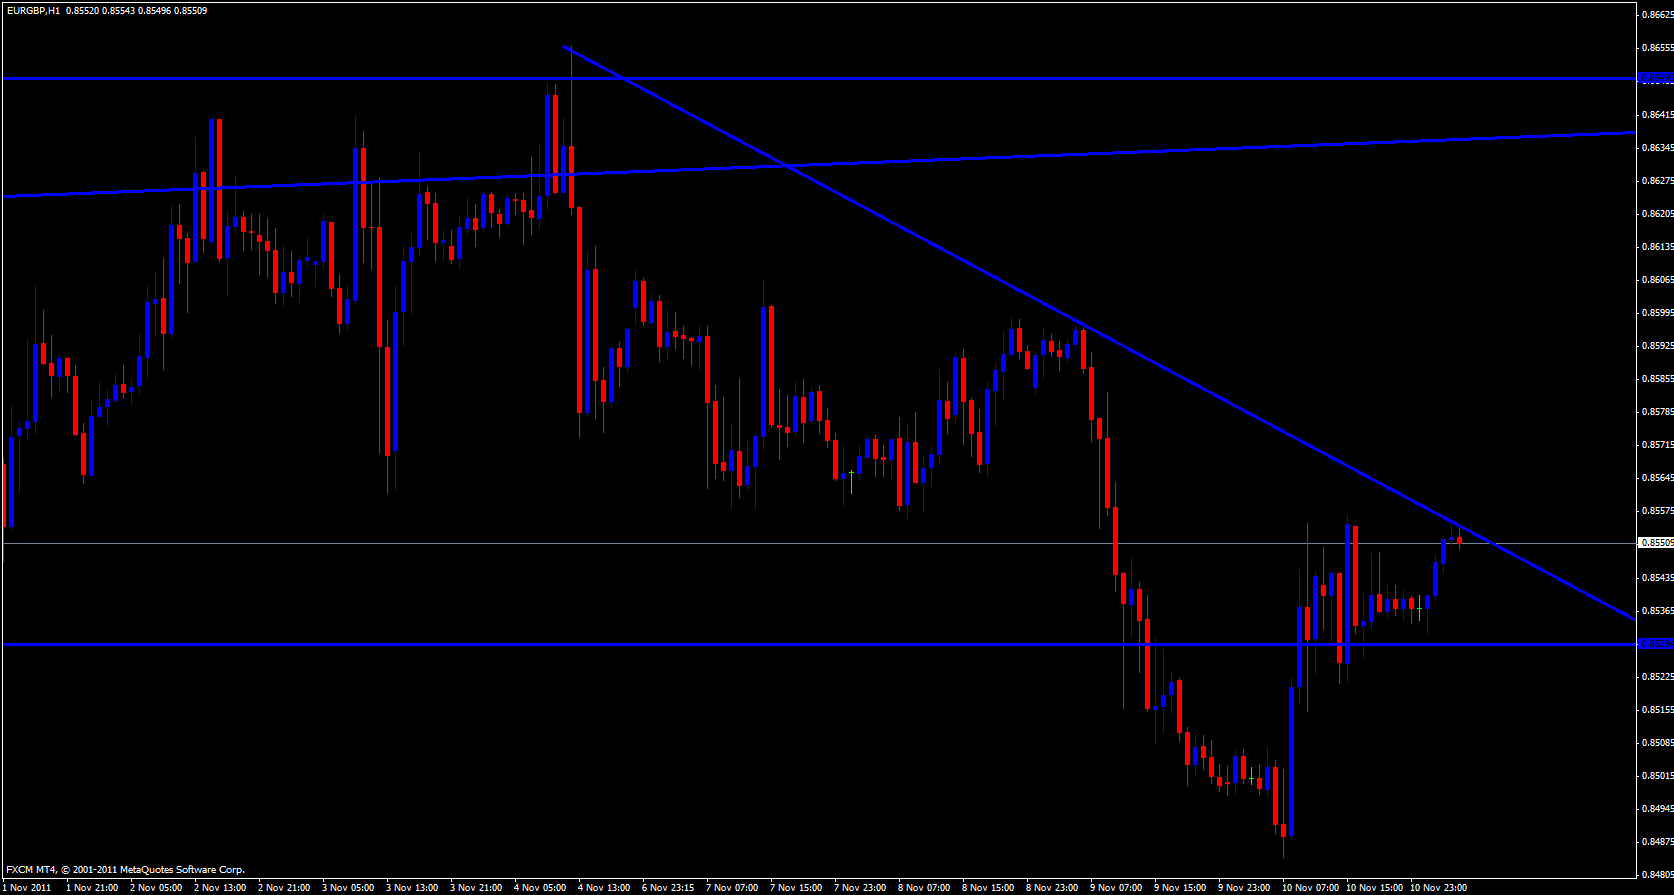
On the hourly chart price is riding the 5 ema and the upper Bollinger band is pointing up. Moving on to the 15 minute chart the 5 ema looks like it is ready to cross below the 13 ema and stochastics is in the overbought zone beginning to cross down. Price is tapping against yesterdays high at .8557 with the daily M3 at .8547 Price has also poked the Weekly S1 at .8552 .


