By: Doug Rosen
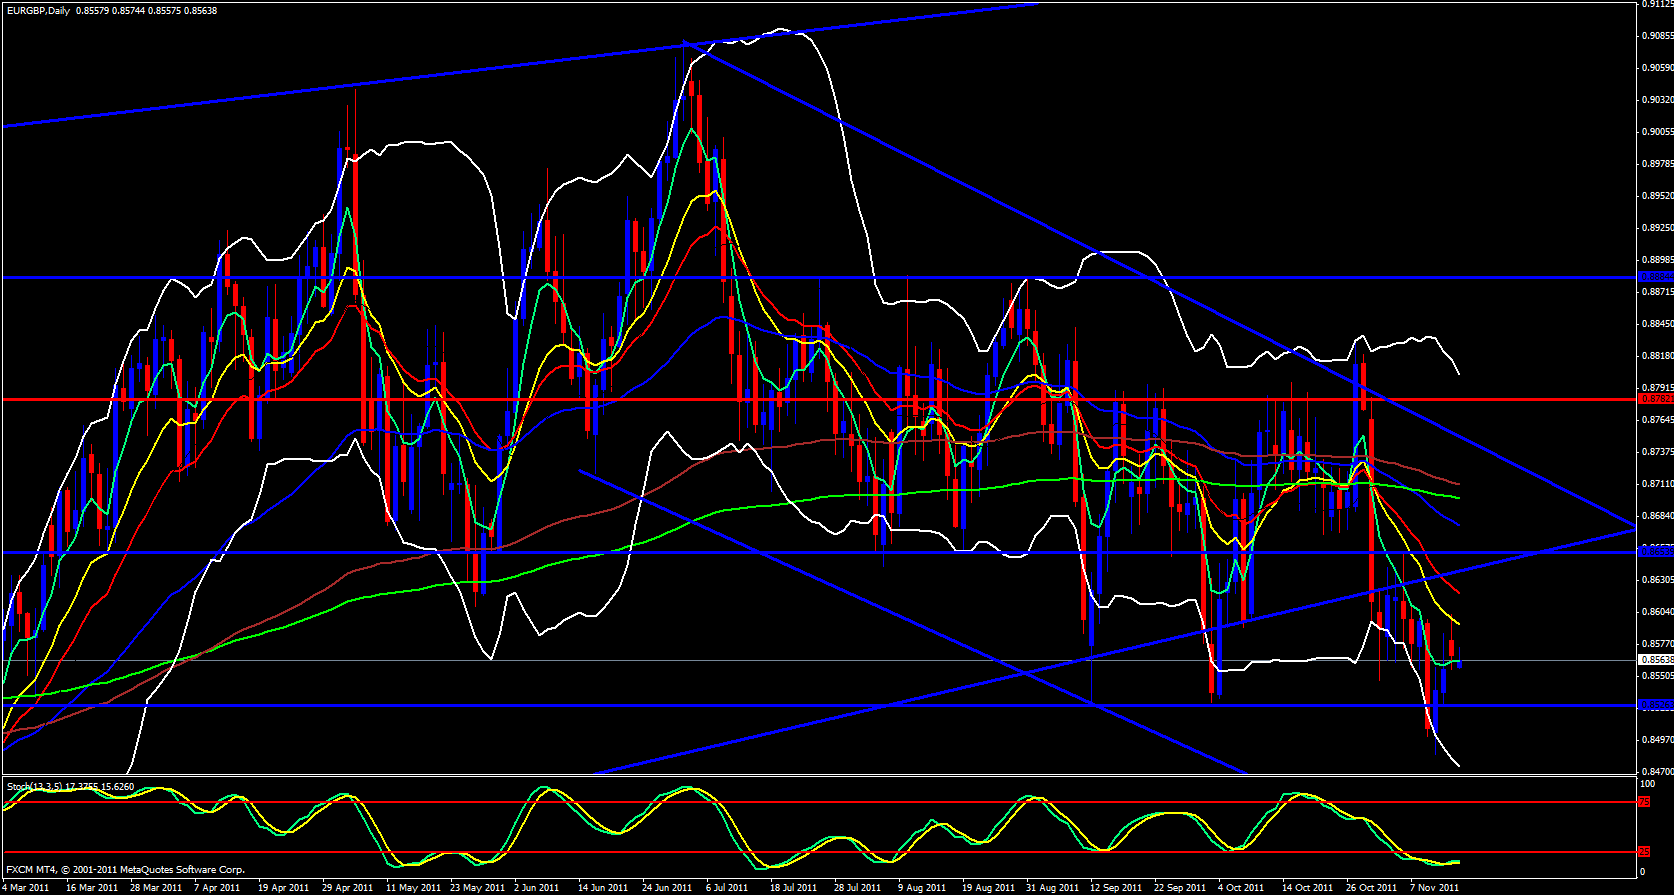
Yesterday this pair retraced up to the 13 ema and dropped. On the daily time frame price is currently touching the 5 ema and the lower Bollinger band is pointing down as is the upper band as well. Price is now touching the 5 ema.
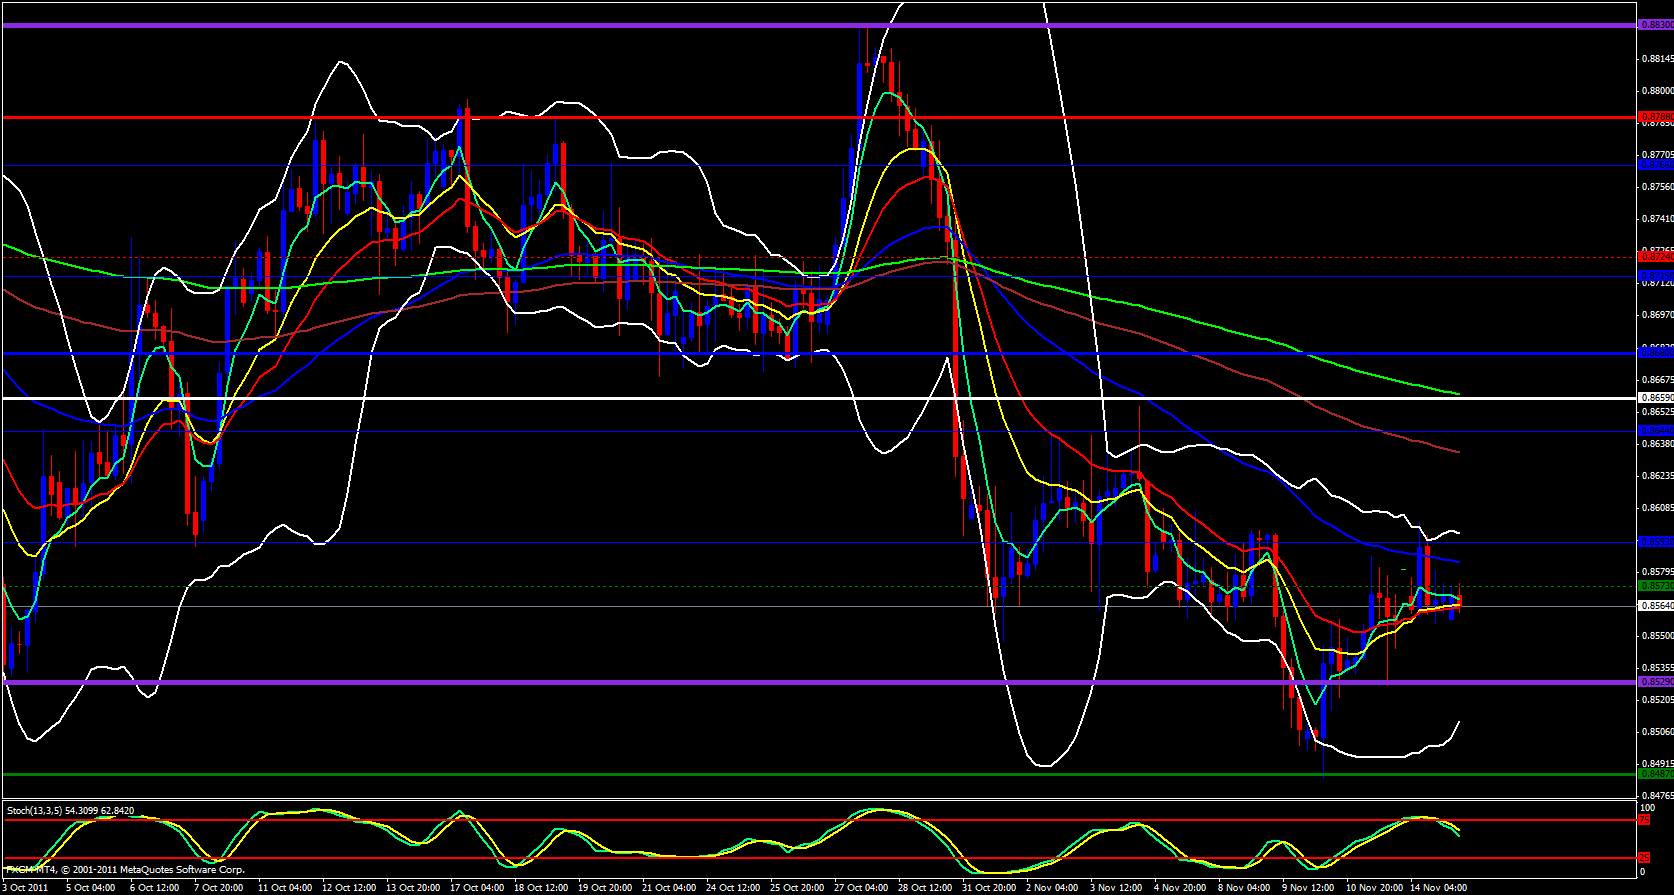
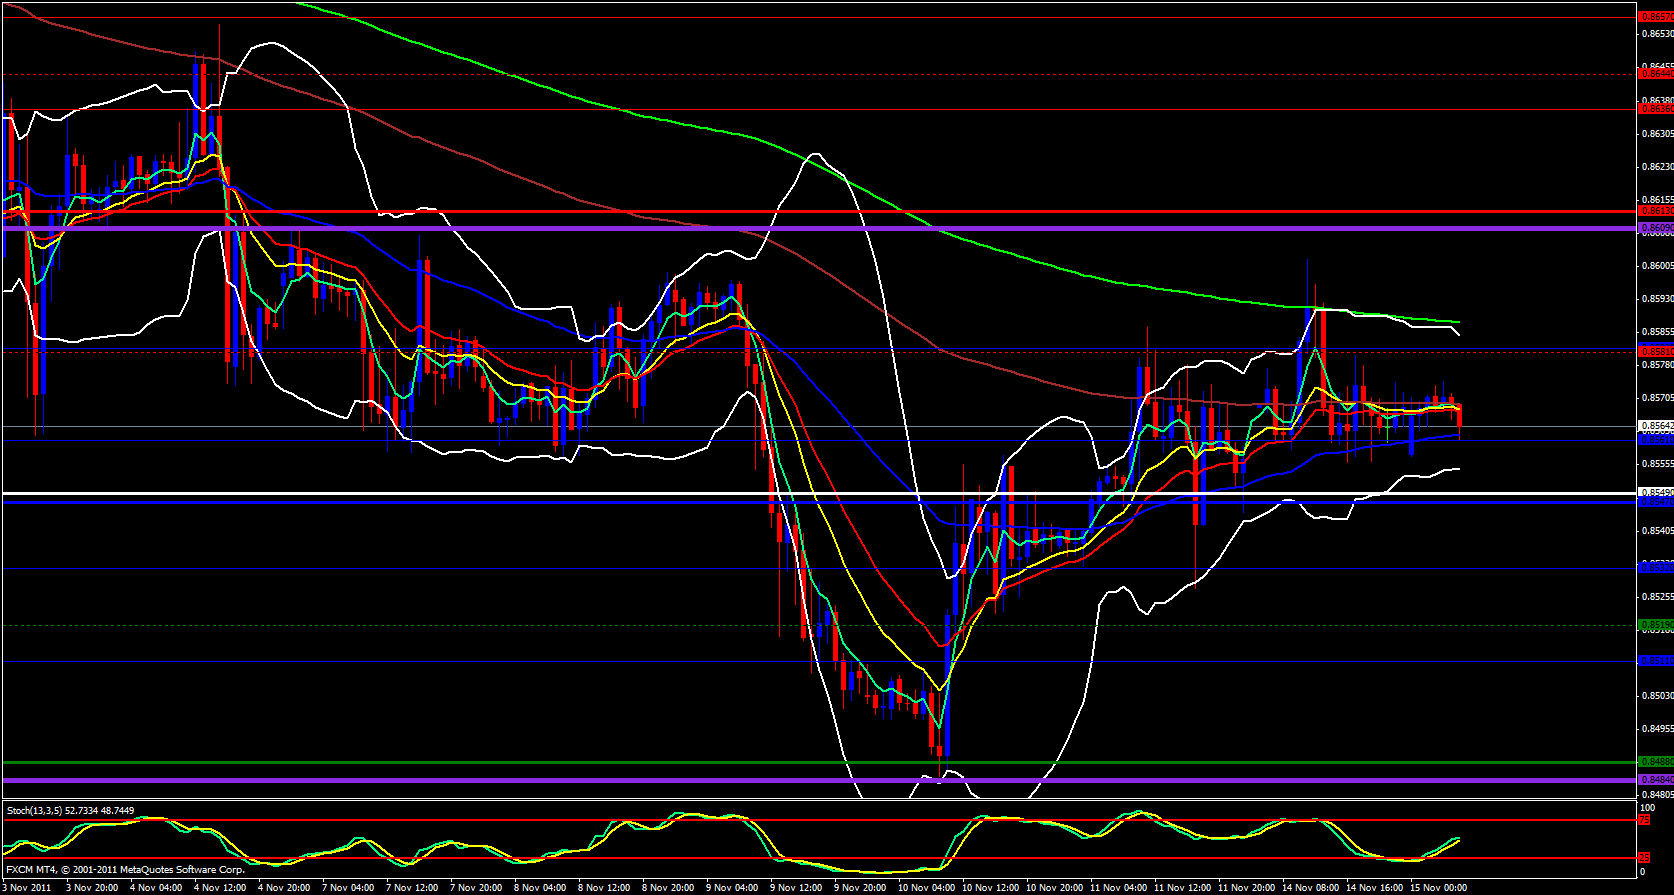
On the weekly time frame price is outside of the channel it had previously been trapped in and price is below the 5 ema. The weekly time frame looks incredibly bearish and I expect a down week. Last week it wicked the 144 then bounced up, retested the channel price was previously trapped in and is now falling again. The only thing that bugs me is the lower Bollinger band is not open. The stochastics however is pointing down. On the 4 hour time frame price retraced back up to the 55 ema from its drop most likely due to profit taking off the monthly S1 pivot and is currently just below the monthly M2 pivot. Stochastics is also pointing straight down.
On the hourly chart price touched the 233 ema which overlaps with the 4 hour 55 ema and last week's high of .8609 was just a few pips above that zone.
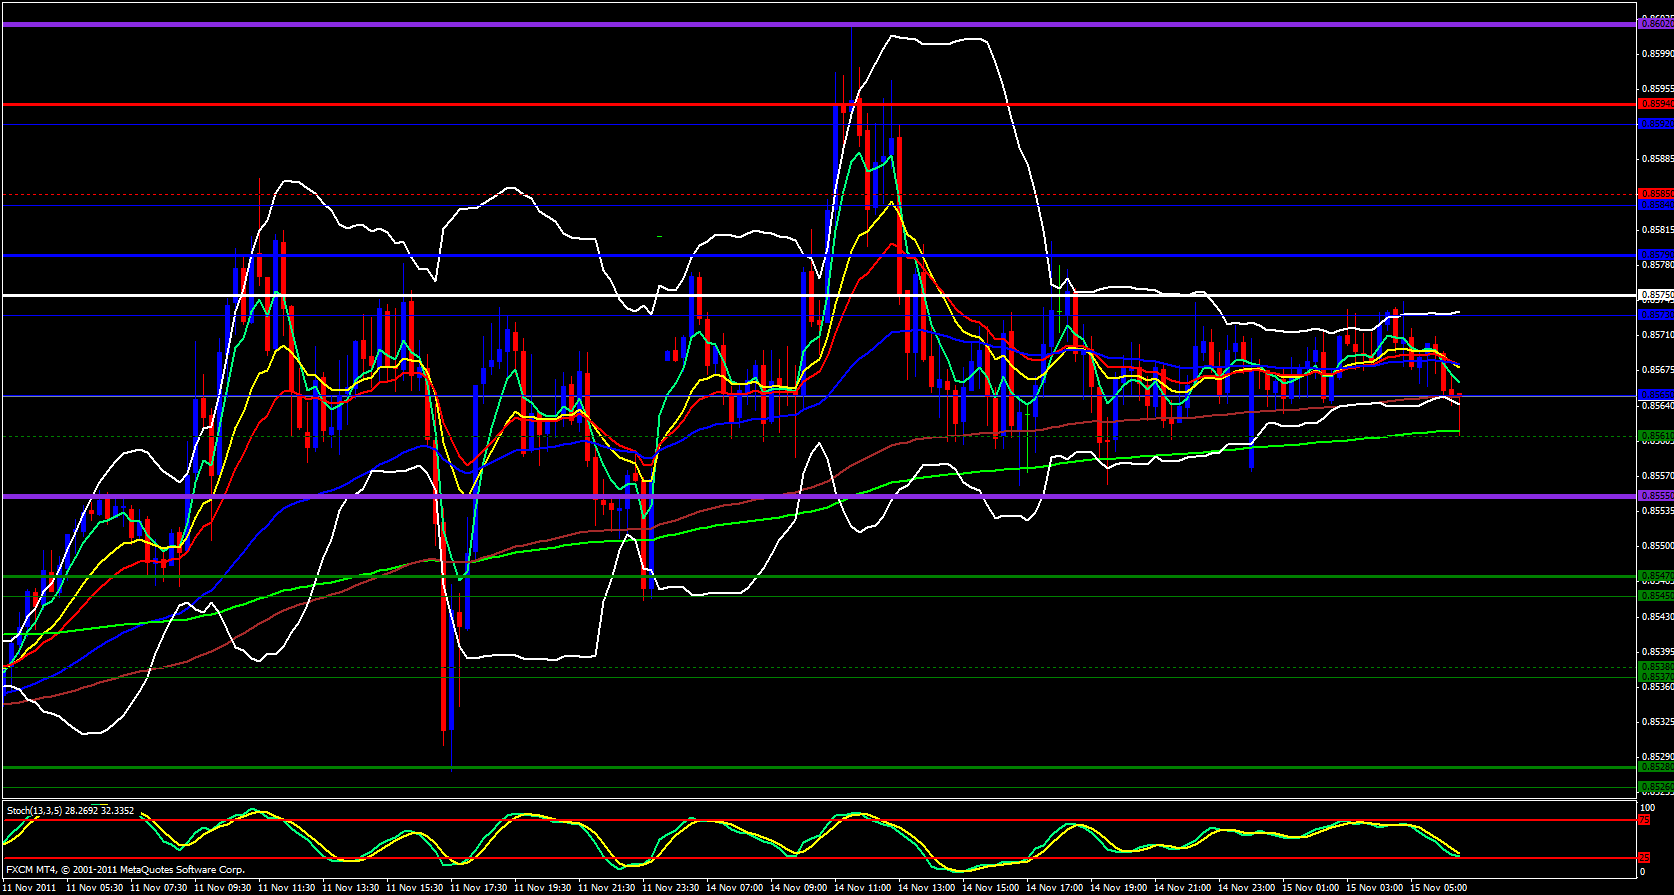
The weekly central pivot point is not to far below price action at .8549 and I do expect that level to break and go down to at least .8484 Price is below the the daily central pivot point at .8575 and on the 15 minute time frame price is above the 233 ema and keeps bouncing off of it, however, as the 5 ema makes its way lower, it should push price below the 233 ema and sent this pair downward.


