By: Doug Rosen
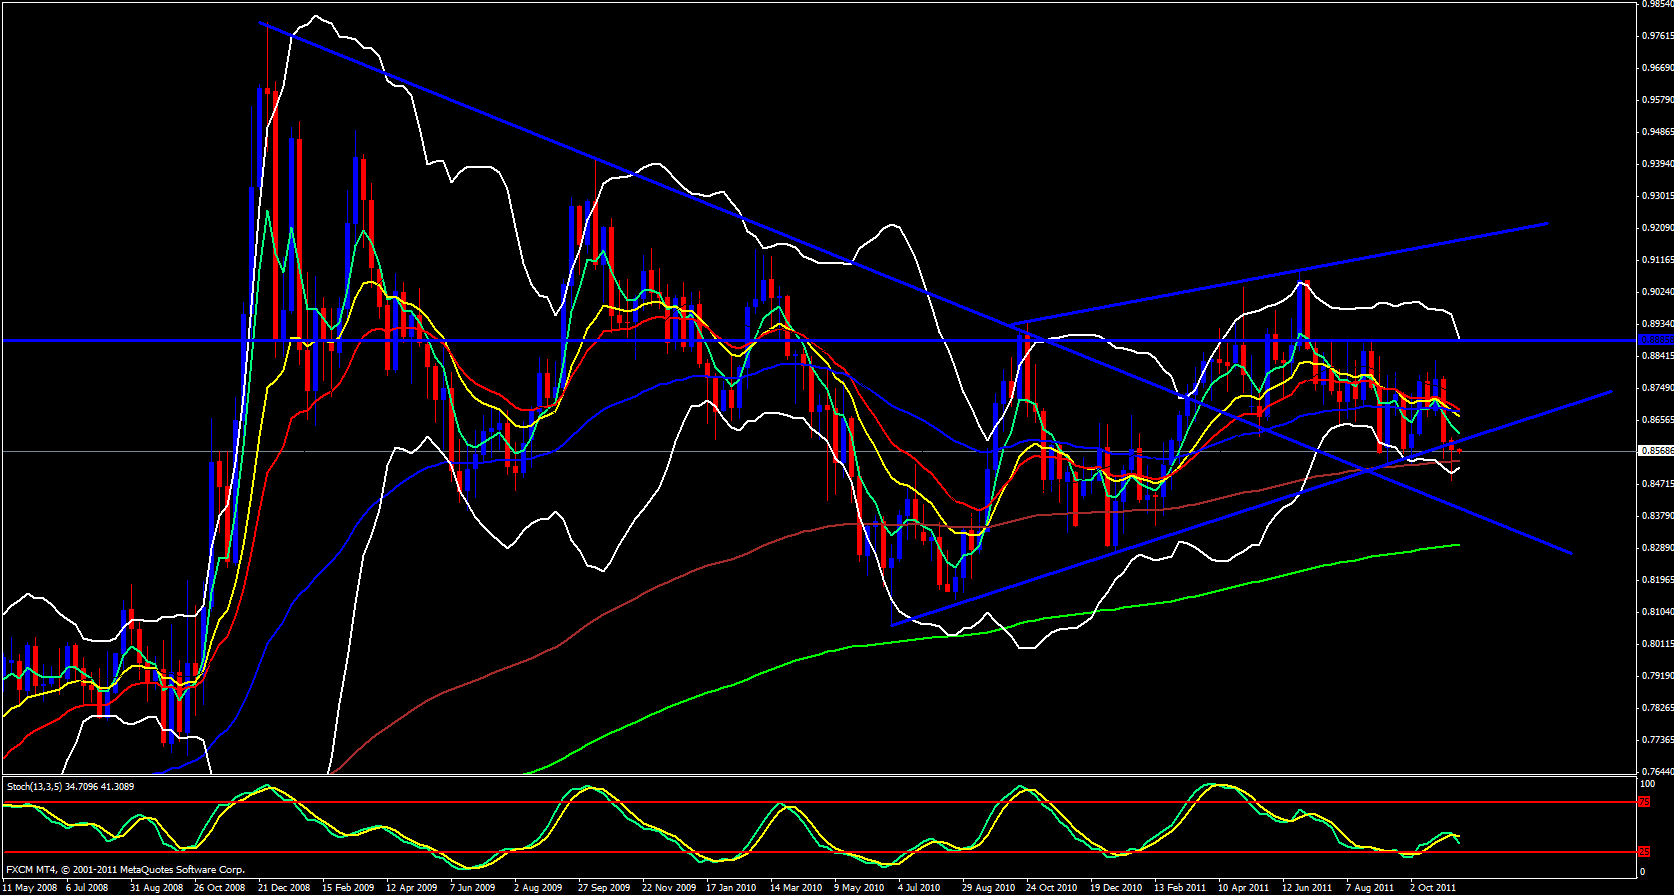
It appears that for the last couple weeks the GBP has been overcoming the EUR. This pair has recently broken some trend lines and support. Beginning with the weekly time frame price has maintained below the 5 ema and the 13 has crossed below the 55 and the stochastics is pointing down, however, the new weekly candle is spaced away from the 5 ema and the lower Bollinger band is pointing up. Last week price touched the lower Bollinger band and jumped. It looks to me that price wants to meet up with the 5 ema.
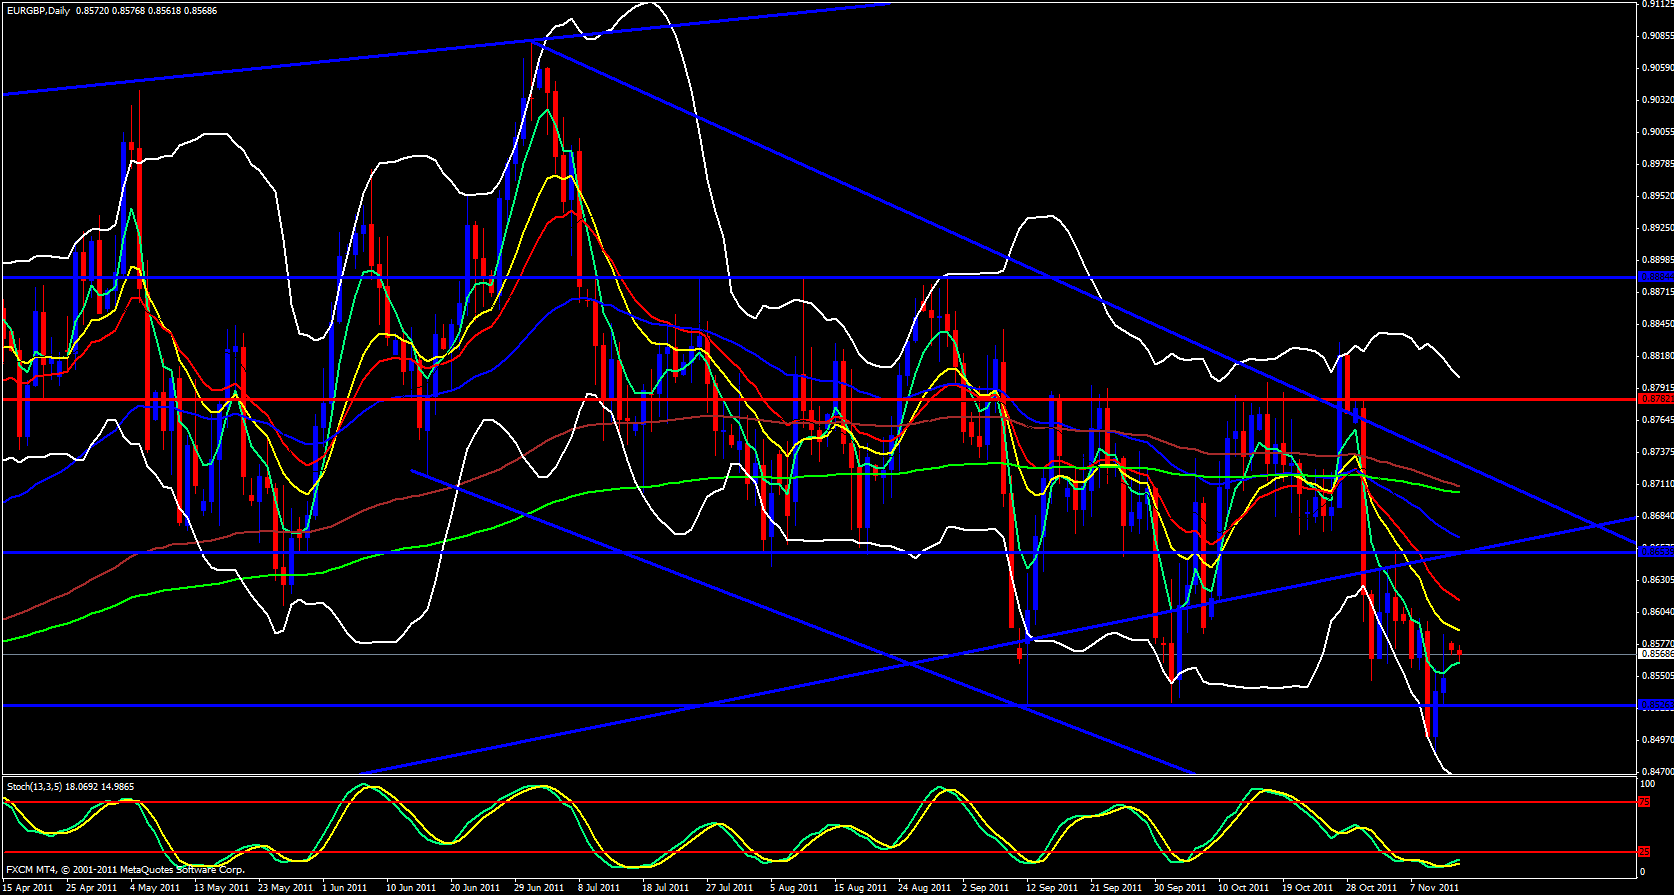
Moving on to the daily time frame it appears to me that the 5 ema is rolling over to the upside, the daily candle is currently above the 5 ema, however, the 13 and 21 are heading down and could take control of price and push it down further.
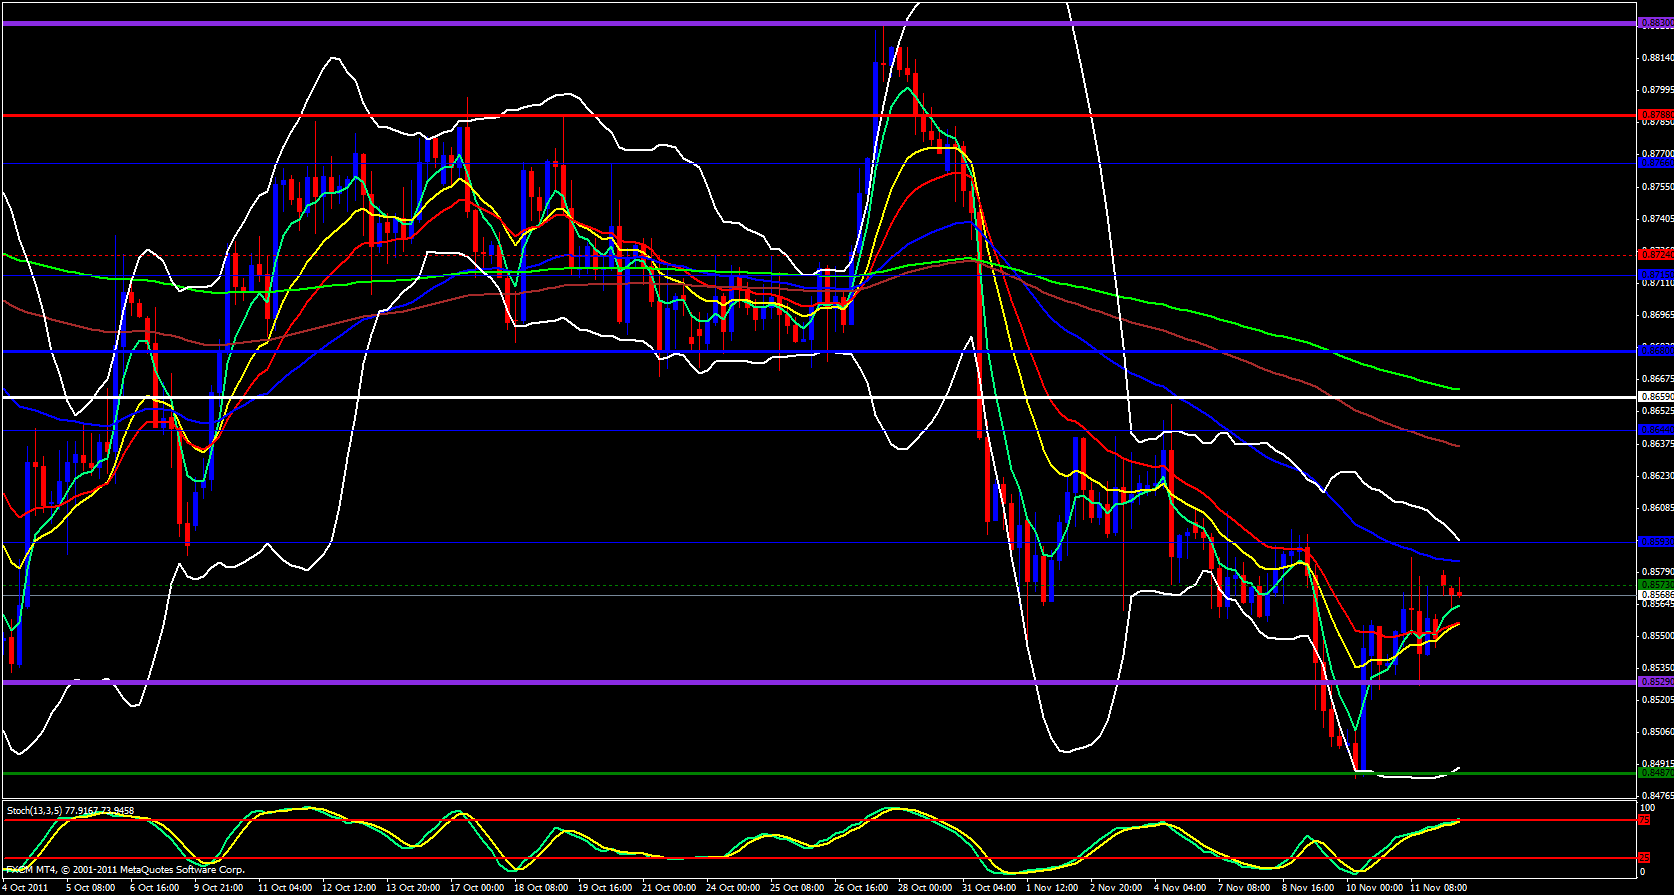
Moving on to the 4 hour time frame I have price confined in a trap. We will see if price breaks out from the trap. We are approaching breakout levels so something has to happen soon.
Price is already busting through the monthly M2 pivot, however, the 55 ema is just above. A break above the .8615 level which is the weekly R1 could constitute a break to the upside. Currently, at the time of this analysis price is just below the weekly M3 with a 233 ema just above that. The stochastics is on the overbought zone. All this could keep price down.
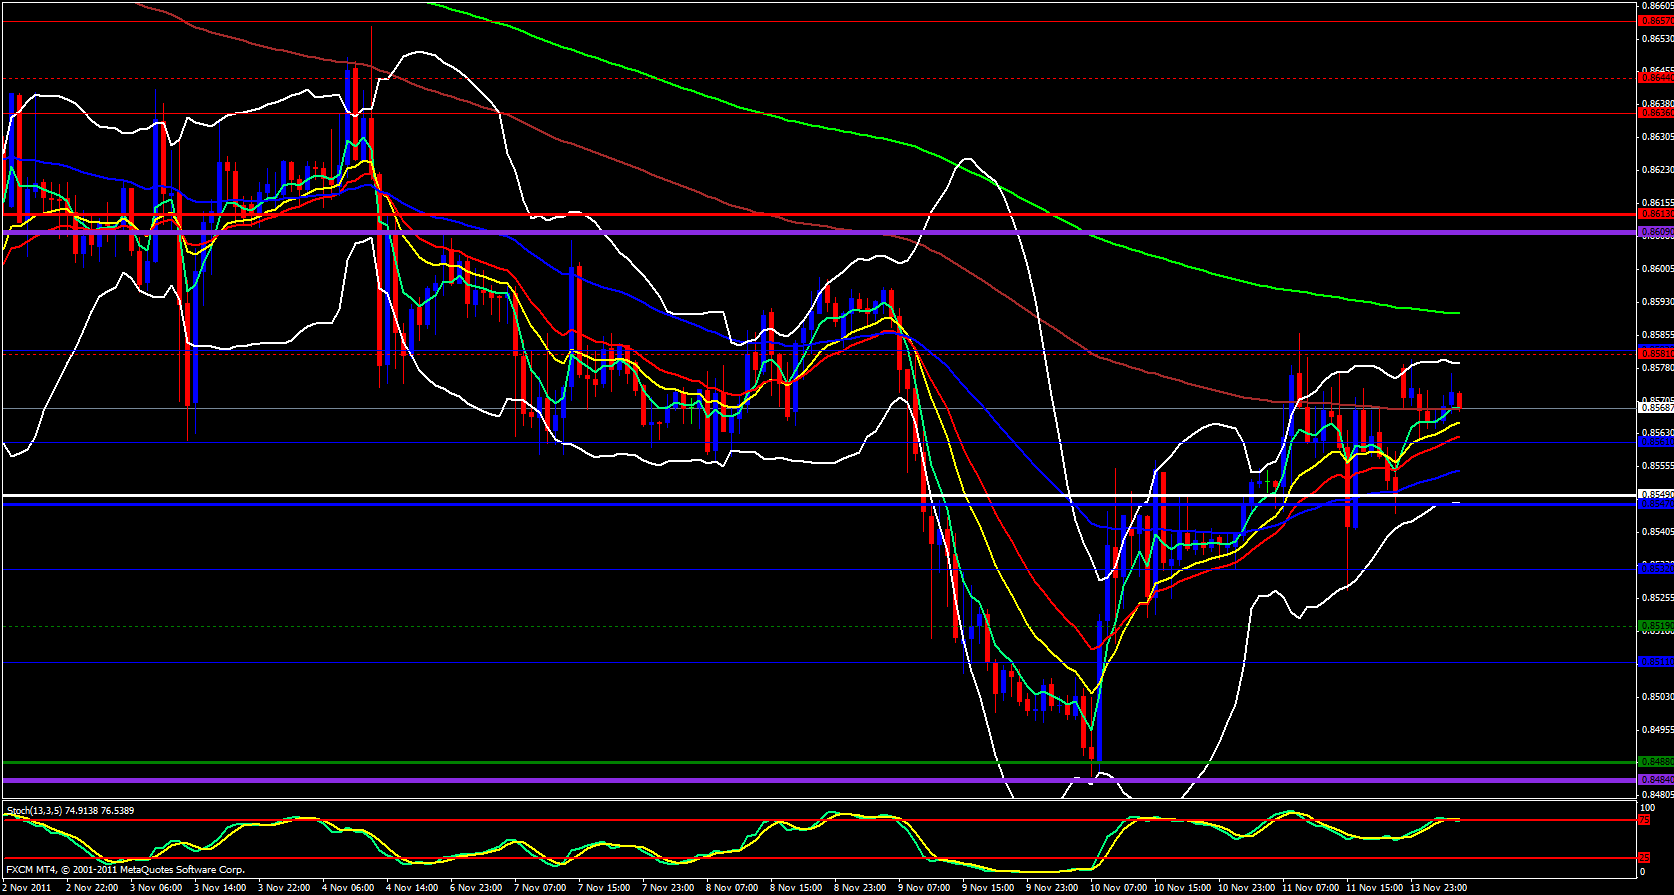
Finally, looking at the 15 minute price does look like it is topping out and there is more resistance than support so we will have to watch this pair carefully.


