By: Doug Rosen
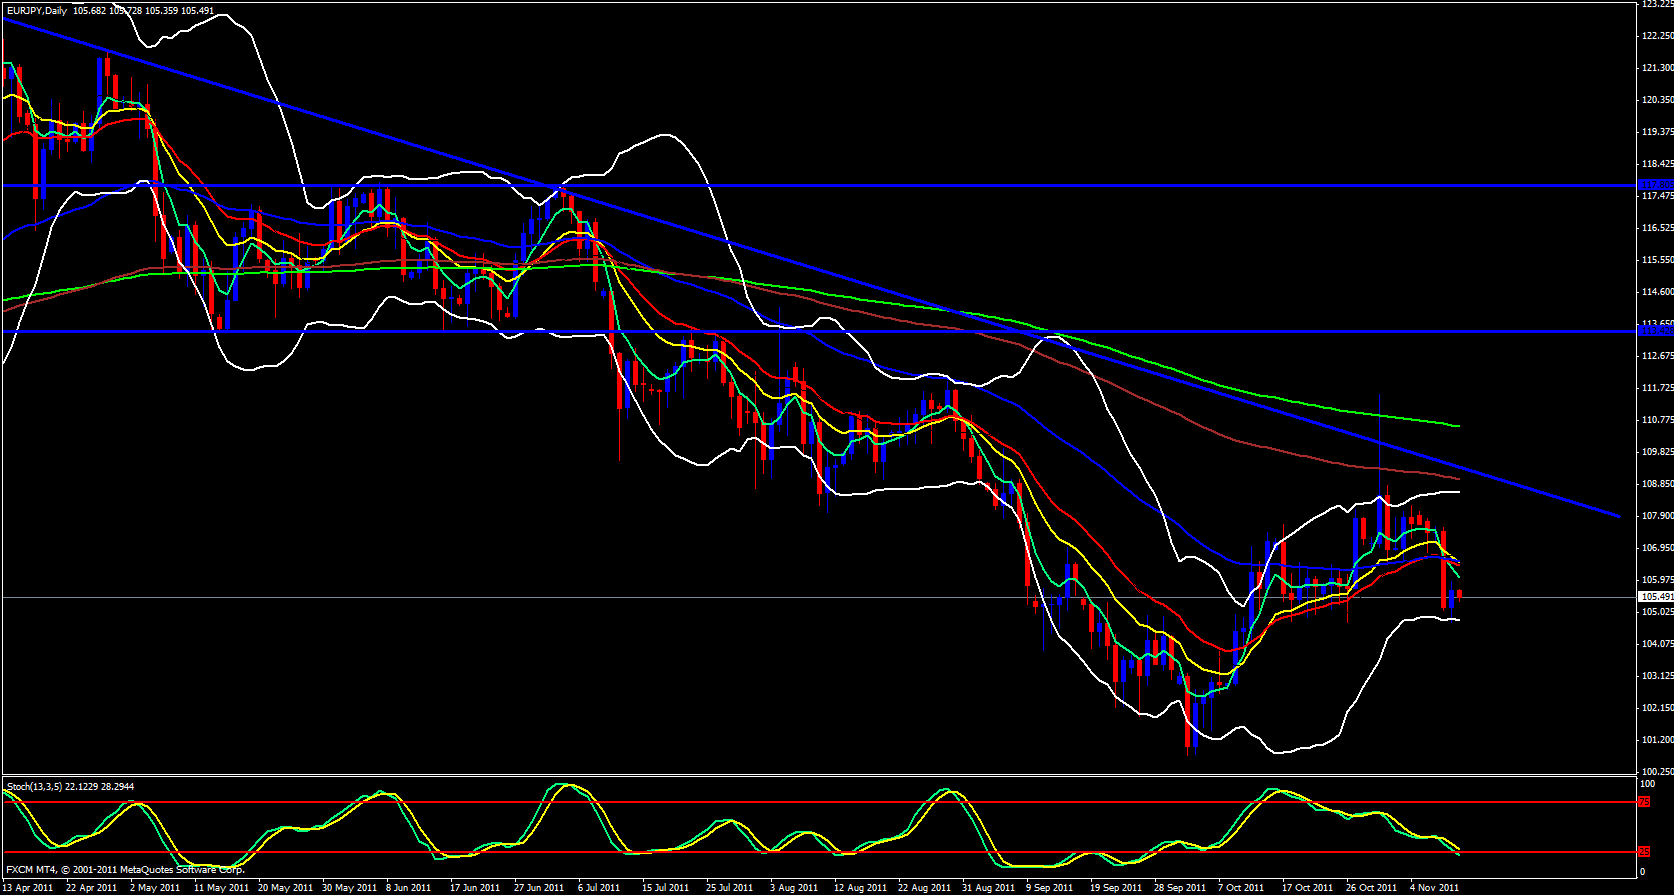
I begin EUR/JPY pair with the daily chart. Price has broken a trend line a couple days ago and price is just below the 5 ema and bouncing off the Bollinger band. The 5 ema is crossing below the 21 and 13 ema's and the stochastics is pointing down.
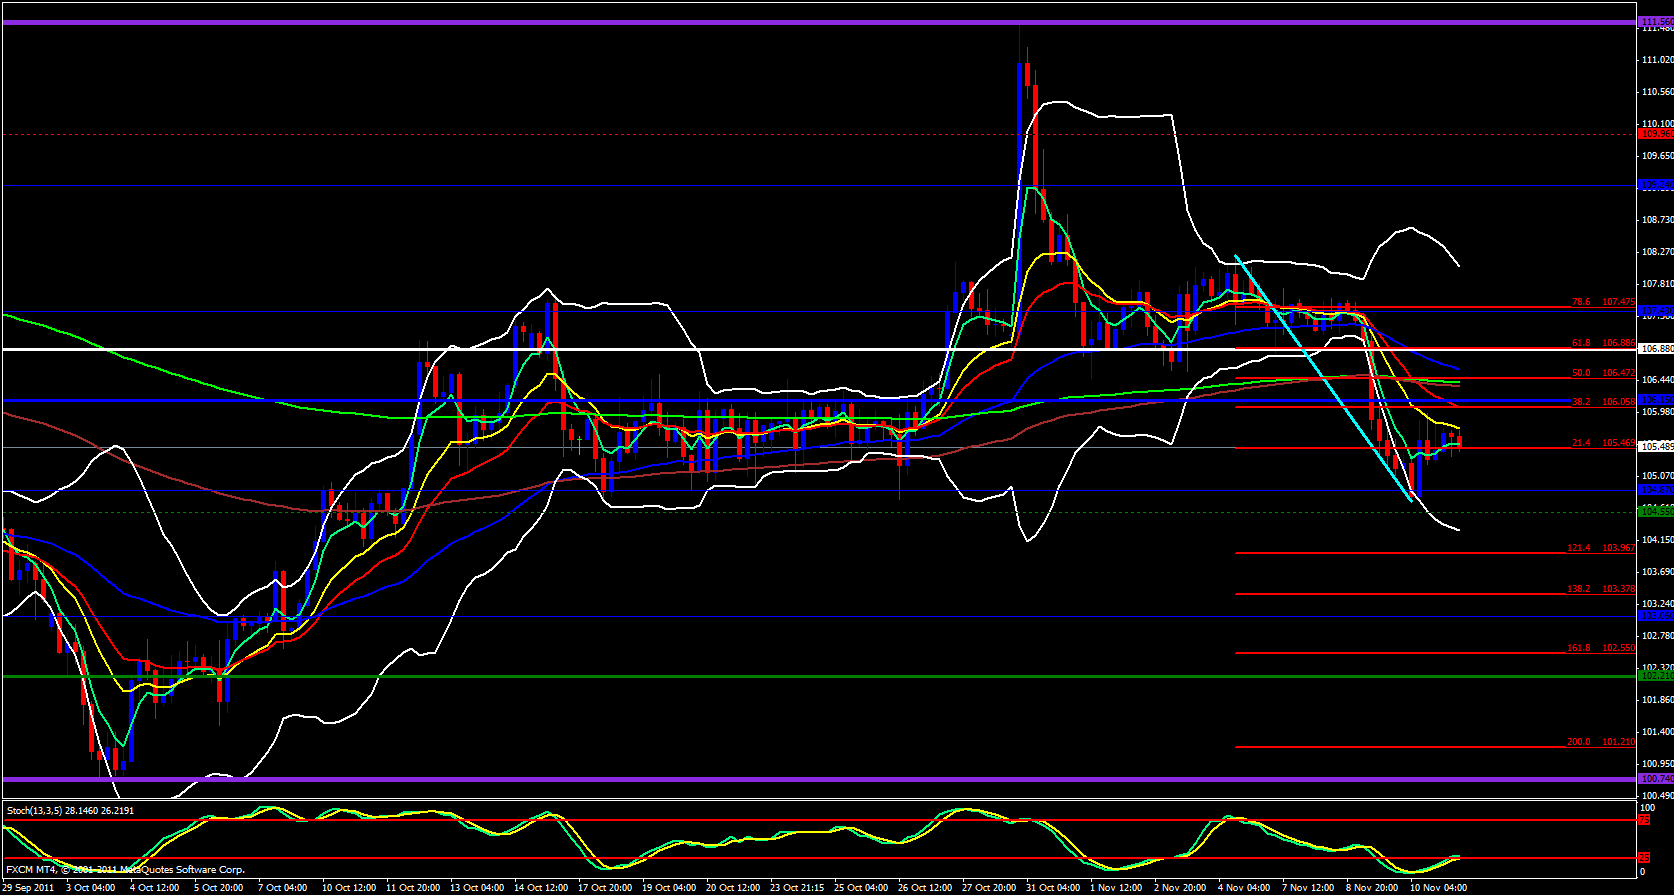
Moving on to the 4 hour timeframe price is still below the 13 ema but we still seem to have some upward buying action.
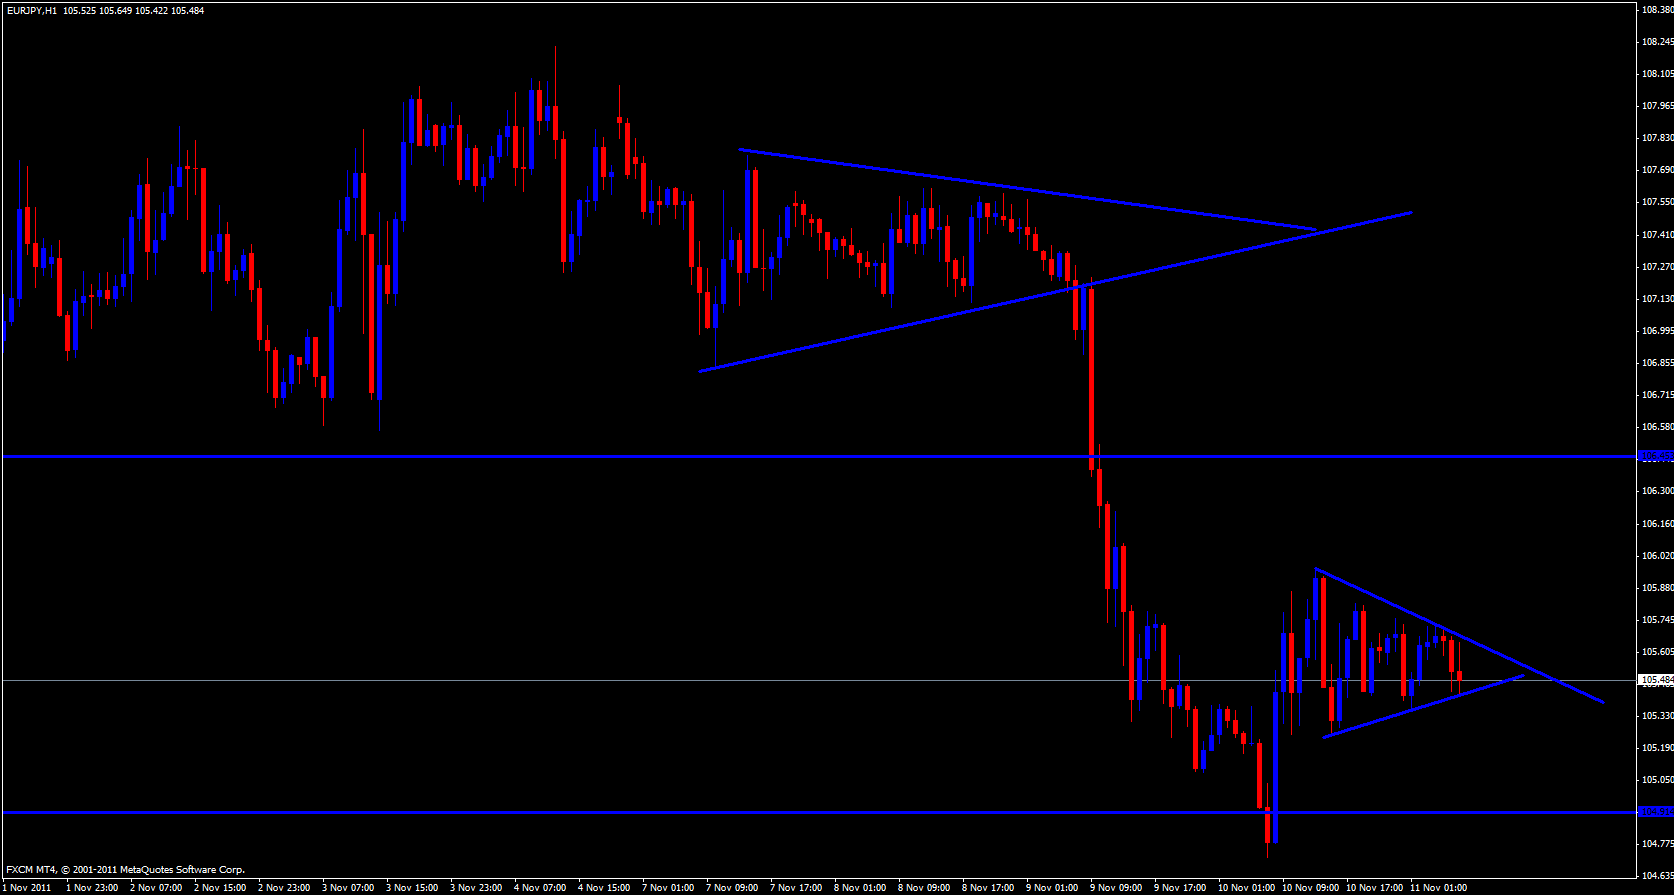
Moving on to the hour chart price is in a trap and in the very nose of the apex and a break has to happen soon.
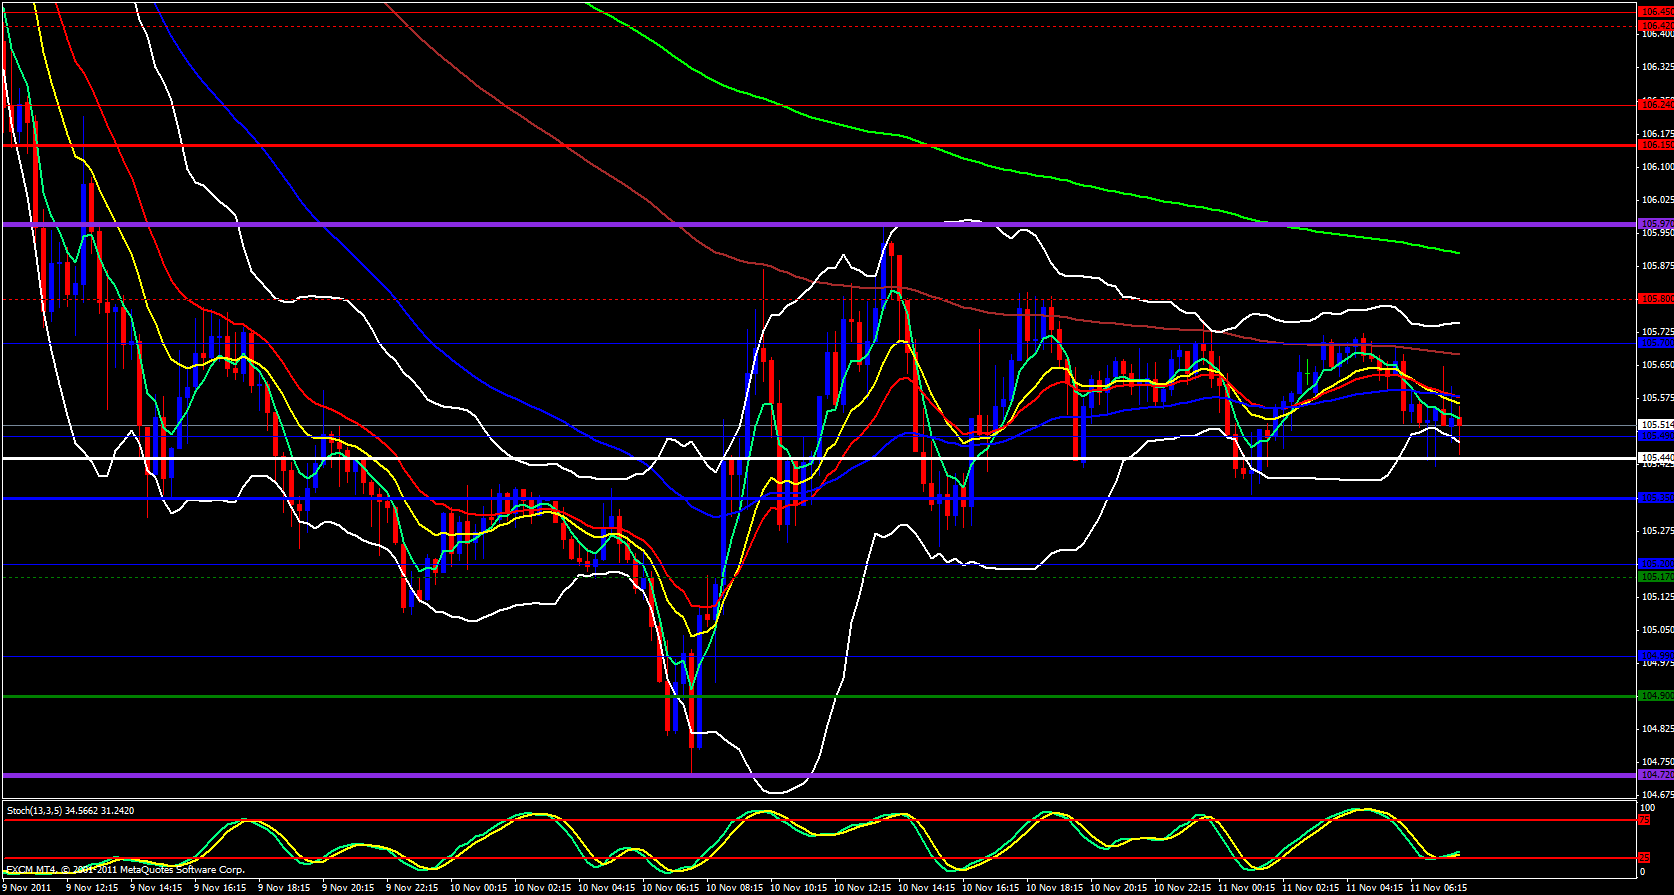
On the 15 minute chart price is in a tight range and price is just above the daily central pivot point at 105.44 which overlaps with the weekly M0 at 105.45 .


