By: Doug Rosen
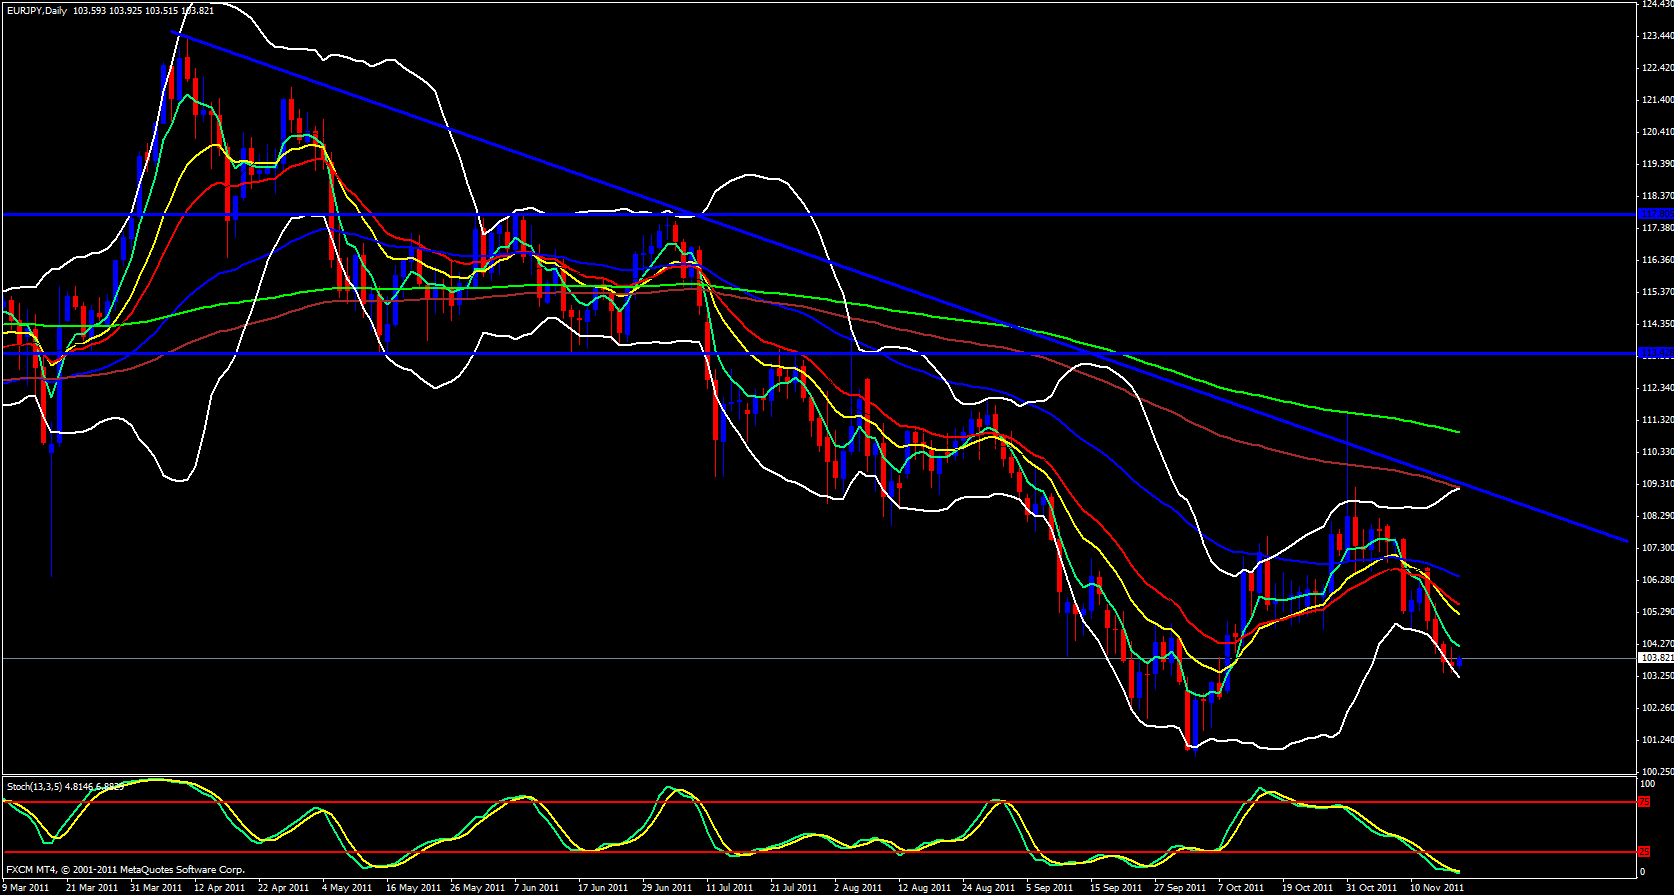
Beginning my analysis today for the EUR/JPY I begin with the daily timeframe and see that price has been riding down the 5 ema and has stayed blow it for most of this past week. The lower Bollinger band is open and pointing down and the stochastics is in the oversold zone bet pointing down sharply.
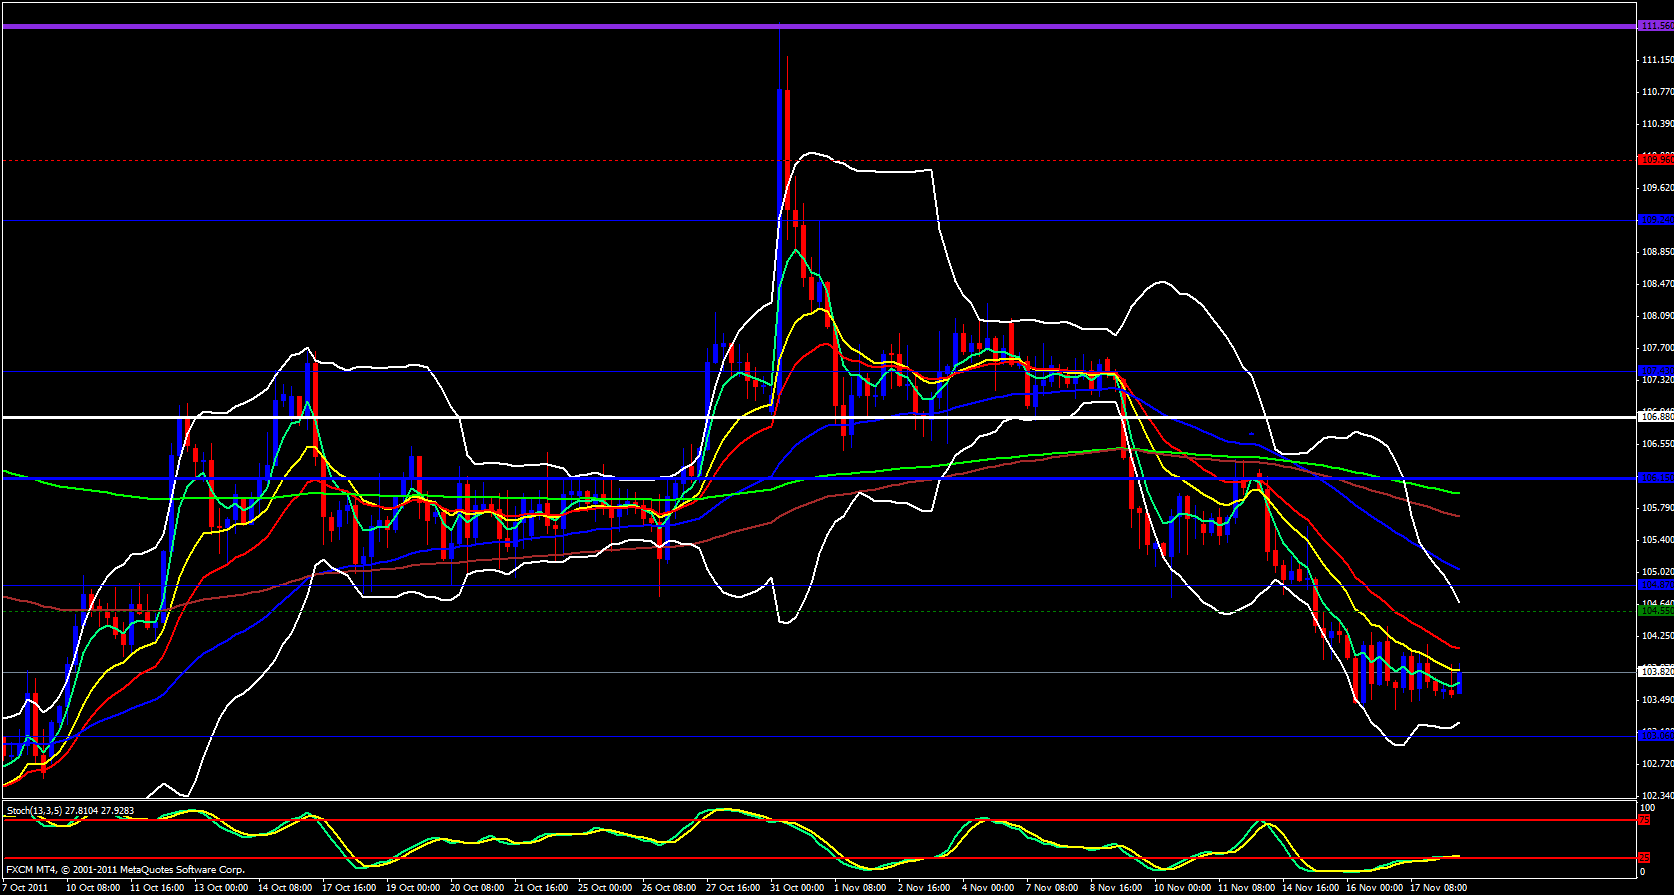
On the 4 hour timeframe price is in a bit of a consolidation pattern but been managing to stay below the 13 ema. Price has managed to stay below my 4 hour trend line.
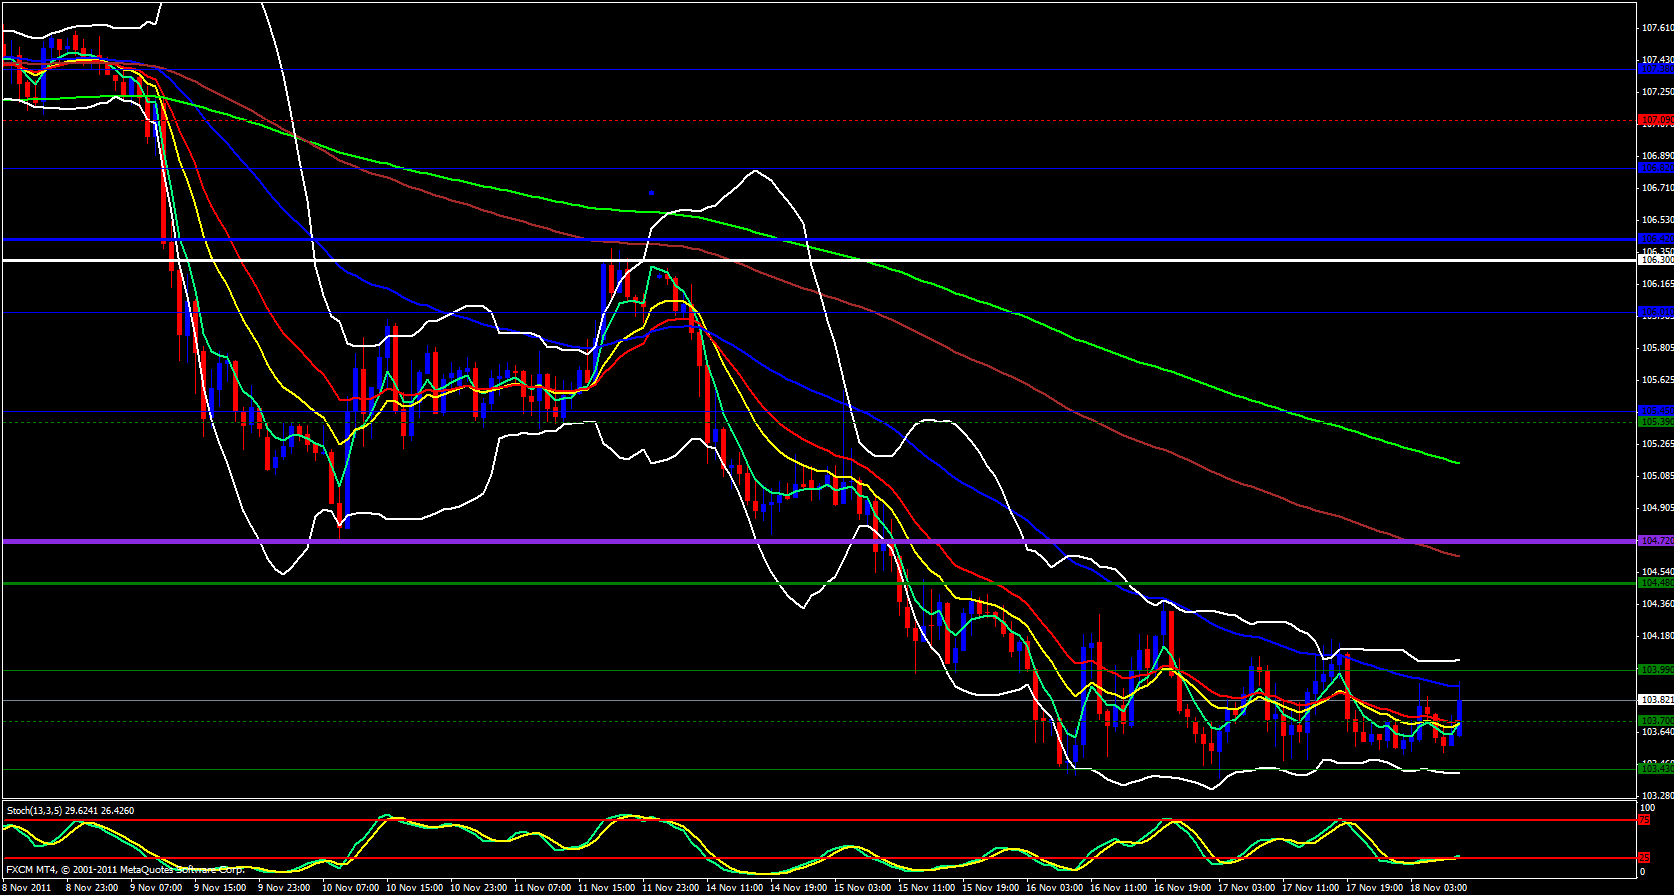
On the 1 hour timeframe prce has also managed to glide down along the ema's and respecting the 55 ema each time.
Finally, on the 15 minute chart timeframe I see price riding down the ema's with price respecting the 233 ema each time it makes contact and the 233 ema is still drifting downward with he daily M3 just below the 233 ema but above price also adding to resistance.


