By: Doug Rosen
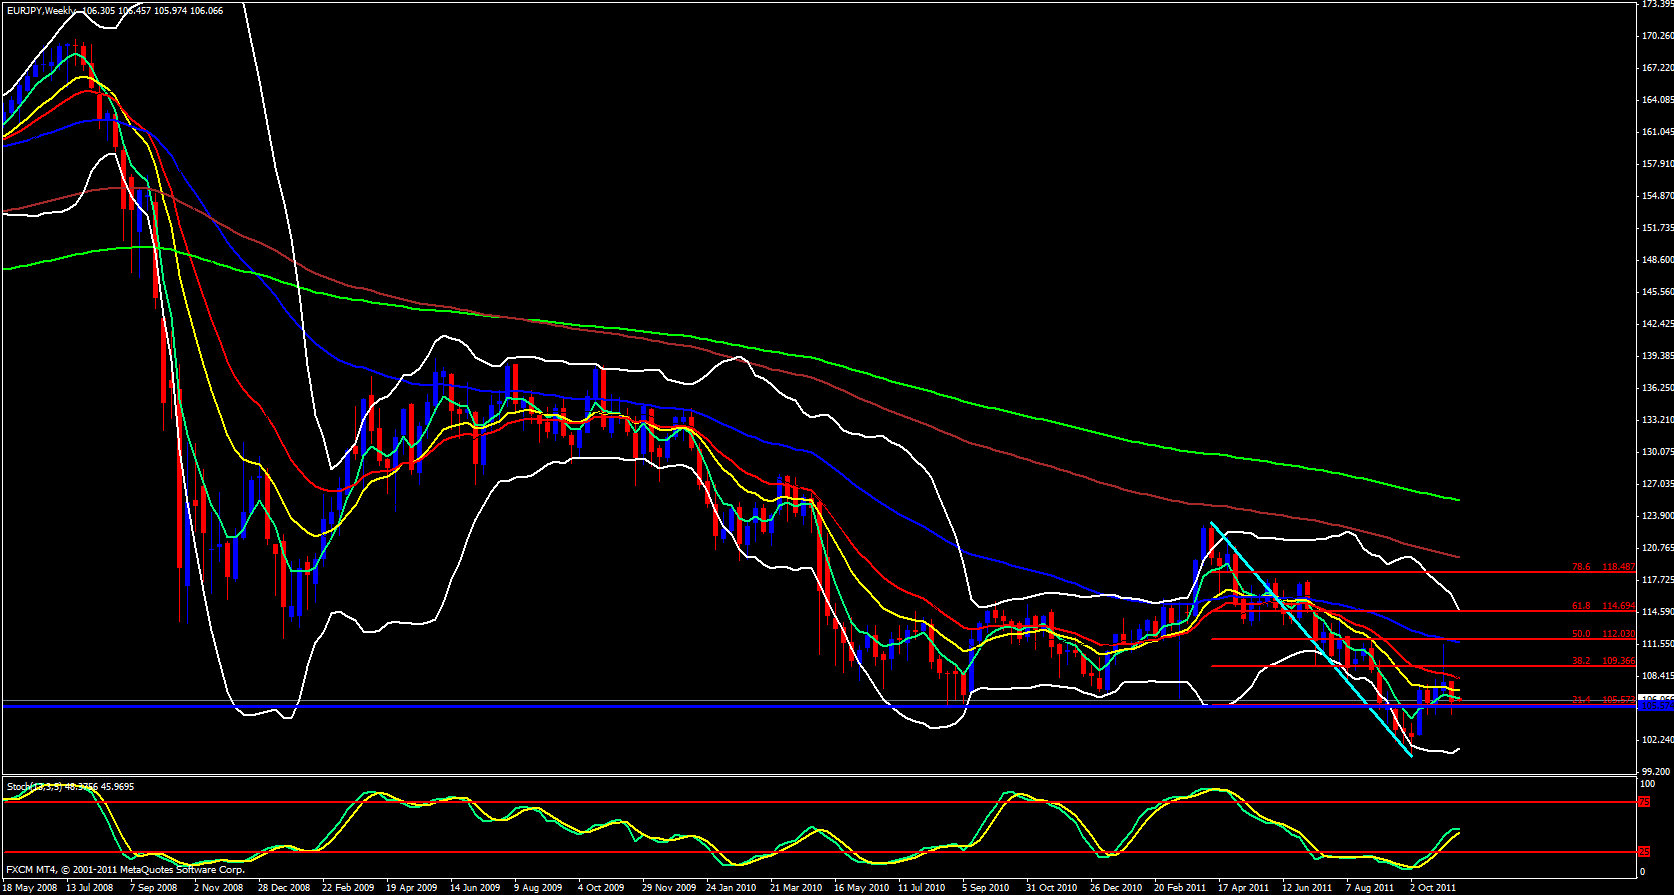
This pair begins its new week below the 5 ema on the weekly time frame. The trend to the downside looks strong. Each of the ema's are in sync with each other and in their respective numerical order in regards to the downtrend.
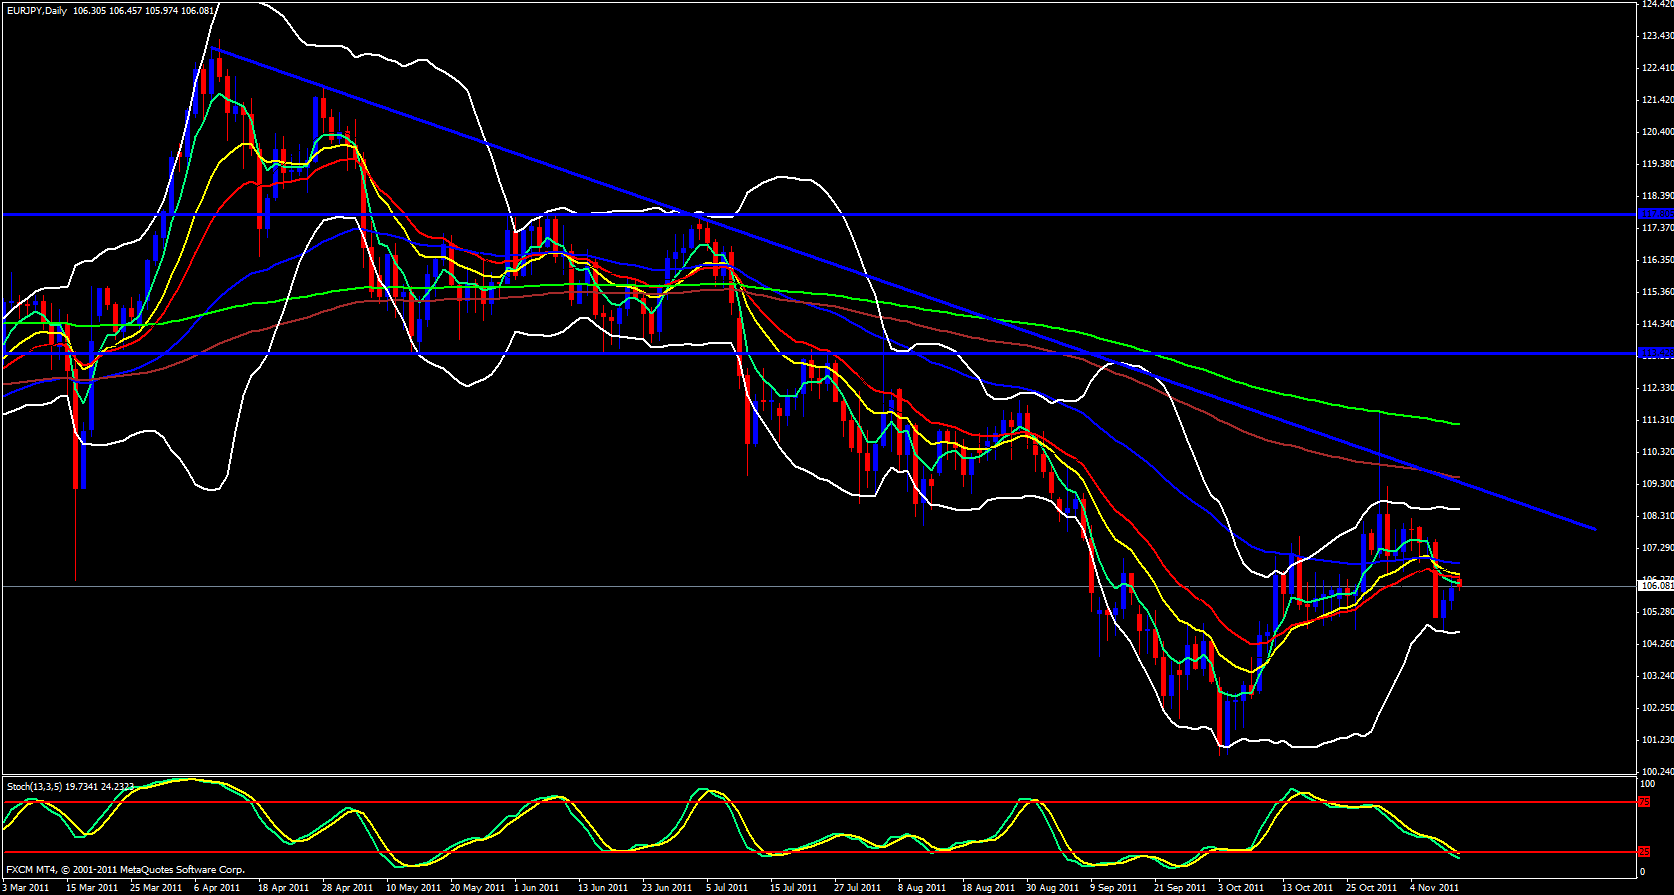
Moving on to the daily time frame price is just below the ema's and the 5 has just crossed below the 55, 21 and 13 ema's.
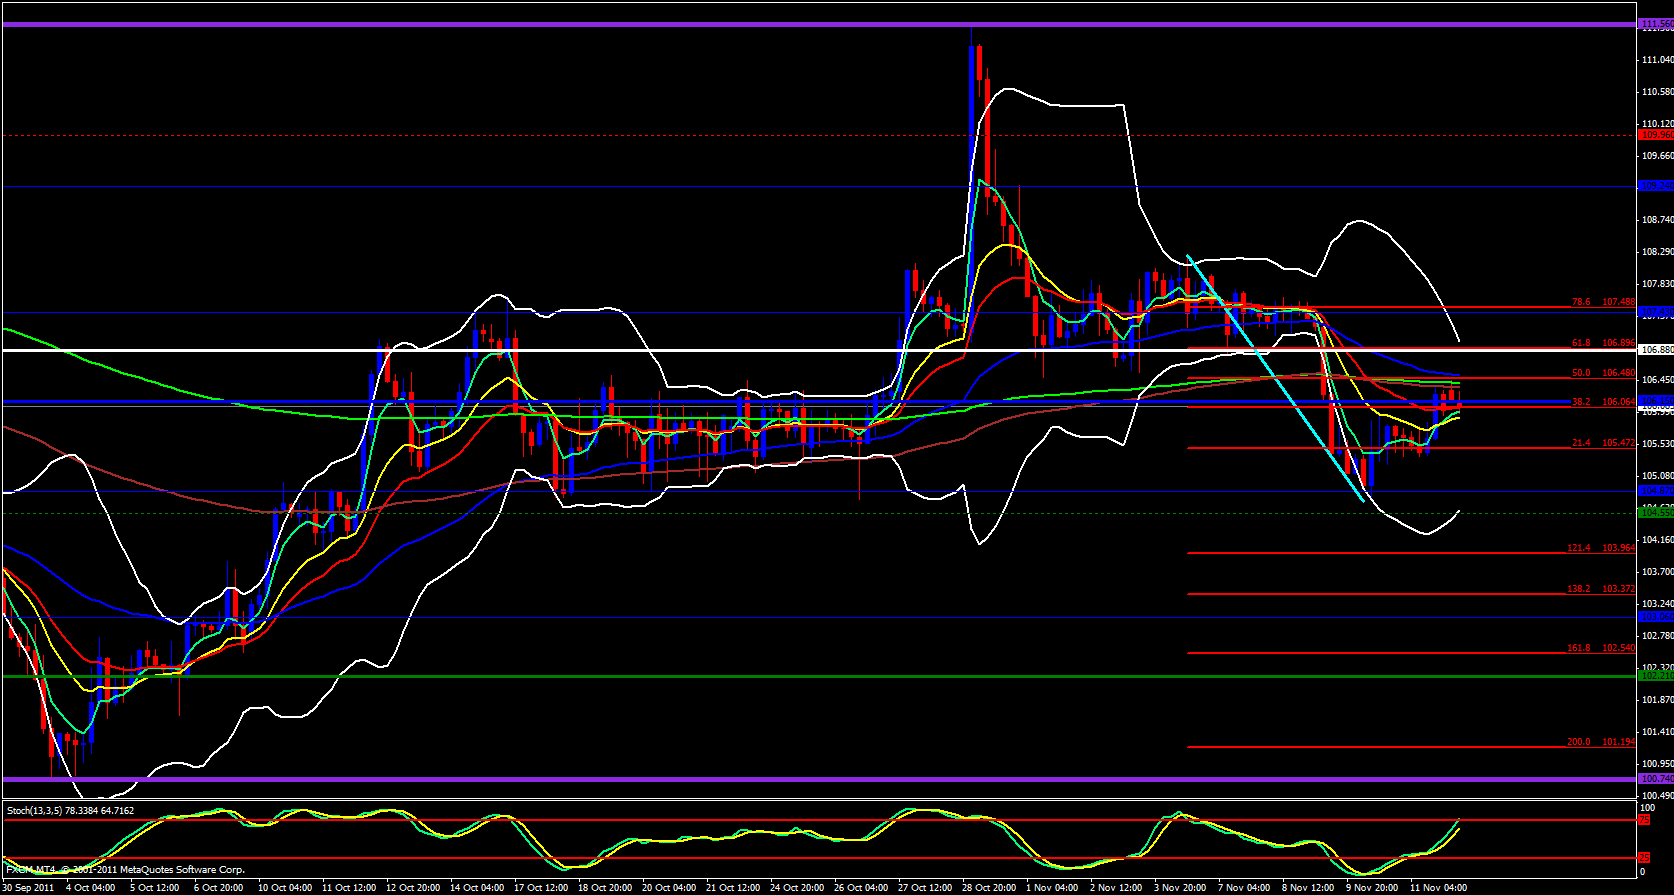
Moving on to the 4 hour time frame price has fibbed off the 50.0 level around 106.48 overlapped with the 55, 233, and 144 ema's as the stochastics makes its way into the overbought zone.
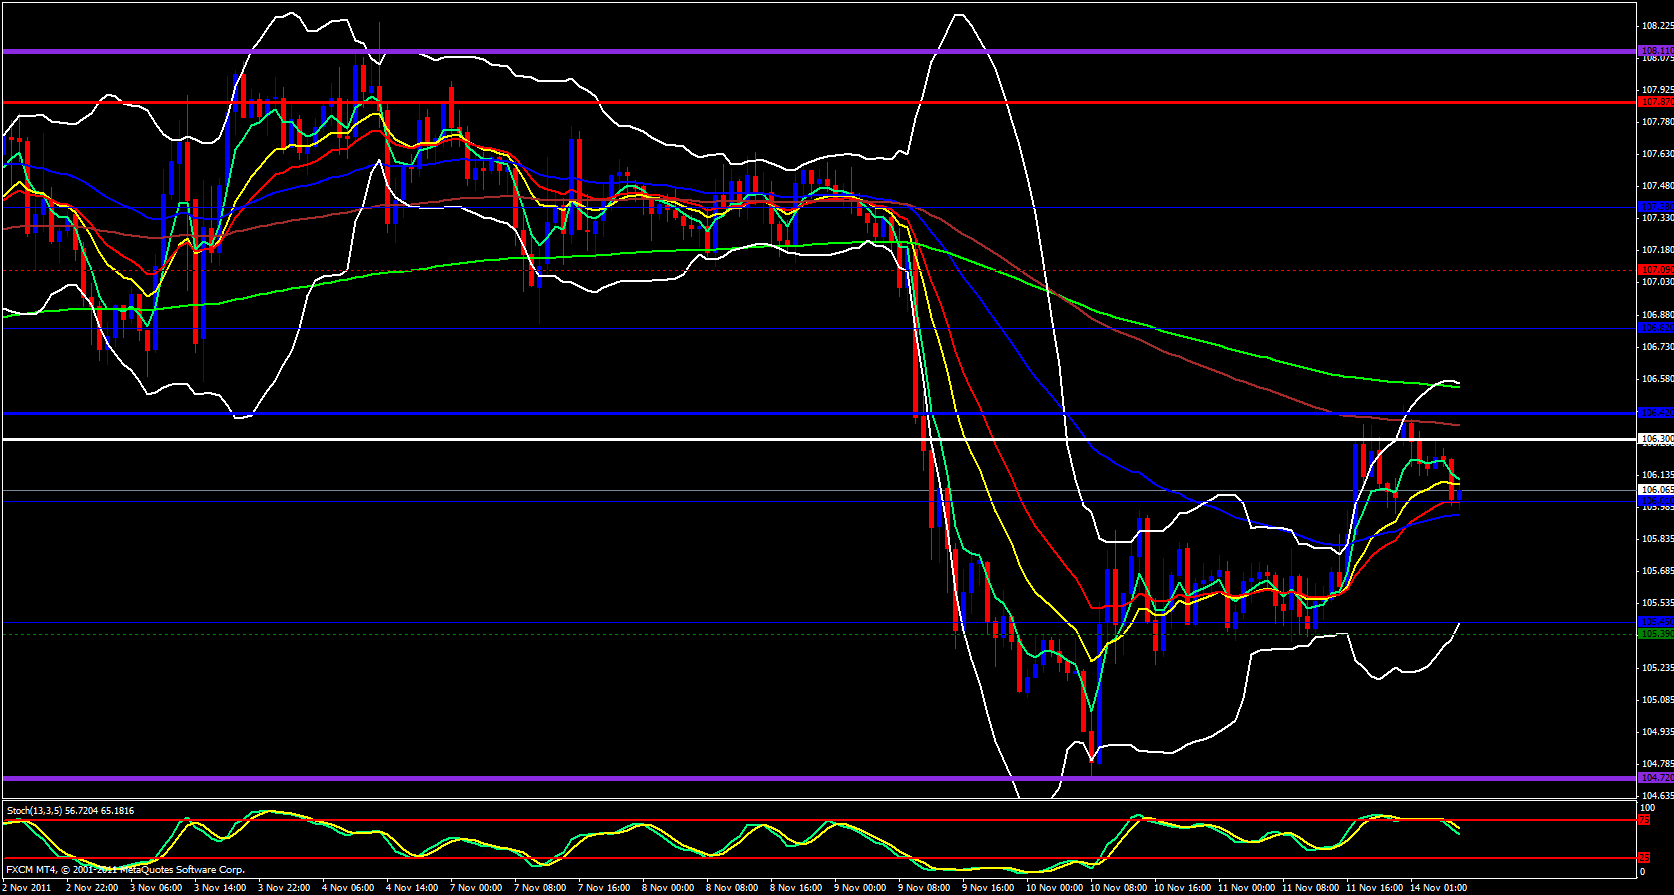
Moving on to the hourly time frame price has bounced off the 144 ema and the 5 ema is prepping to cross below the 13 and the stochastics is coming out of the overbought zone and pointing down.
Finally, on the 15 minute chart price appears to have made a complex top and is below the ema's. Price is currently below the daily R1 pivot at 106.15 and is approaching last Friday's high just below at 105.97. Price has also fallen below the weekly central pivot at 106.30 and is also below the monthly central pivot at 106.88. Putting it all together, this pair is looking bearish for today.


