By: Doug Rosen
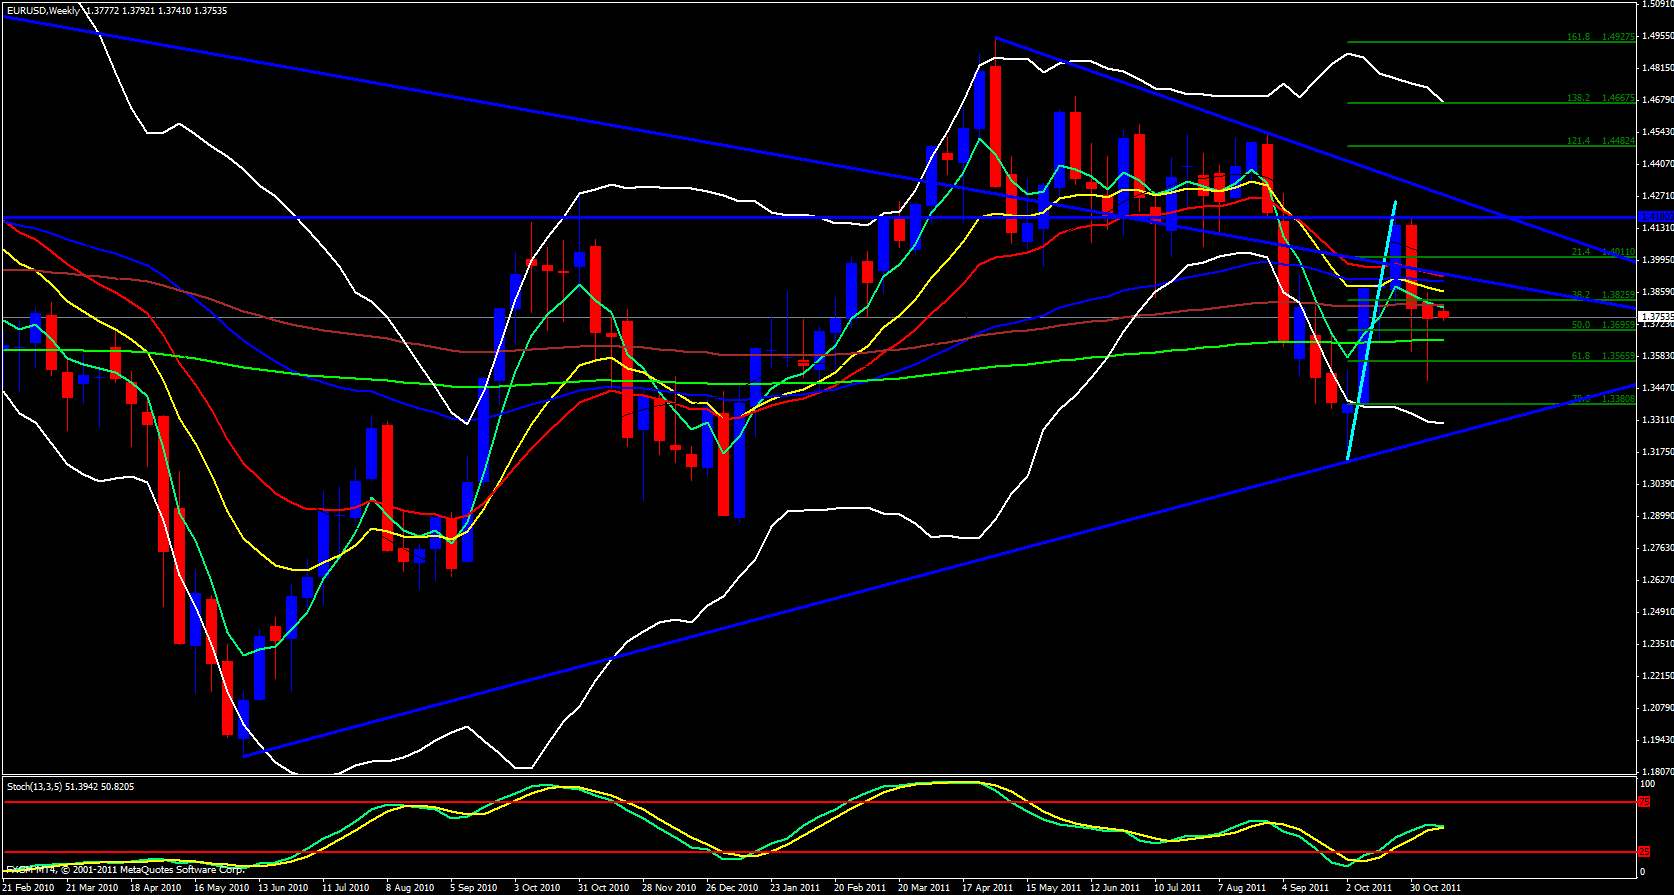
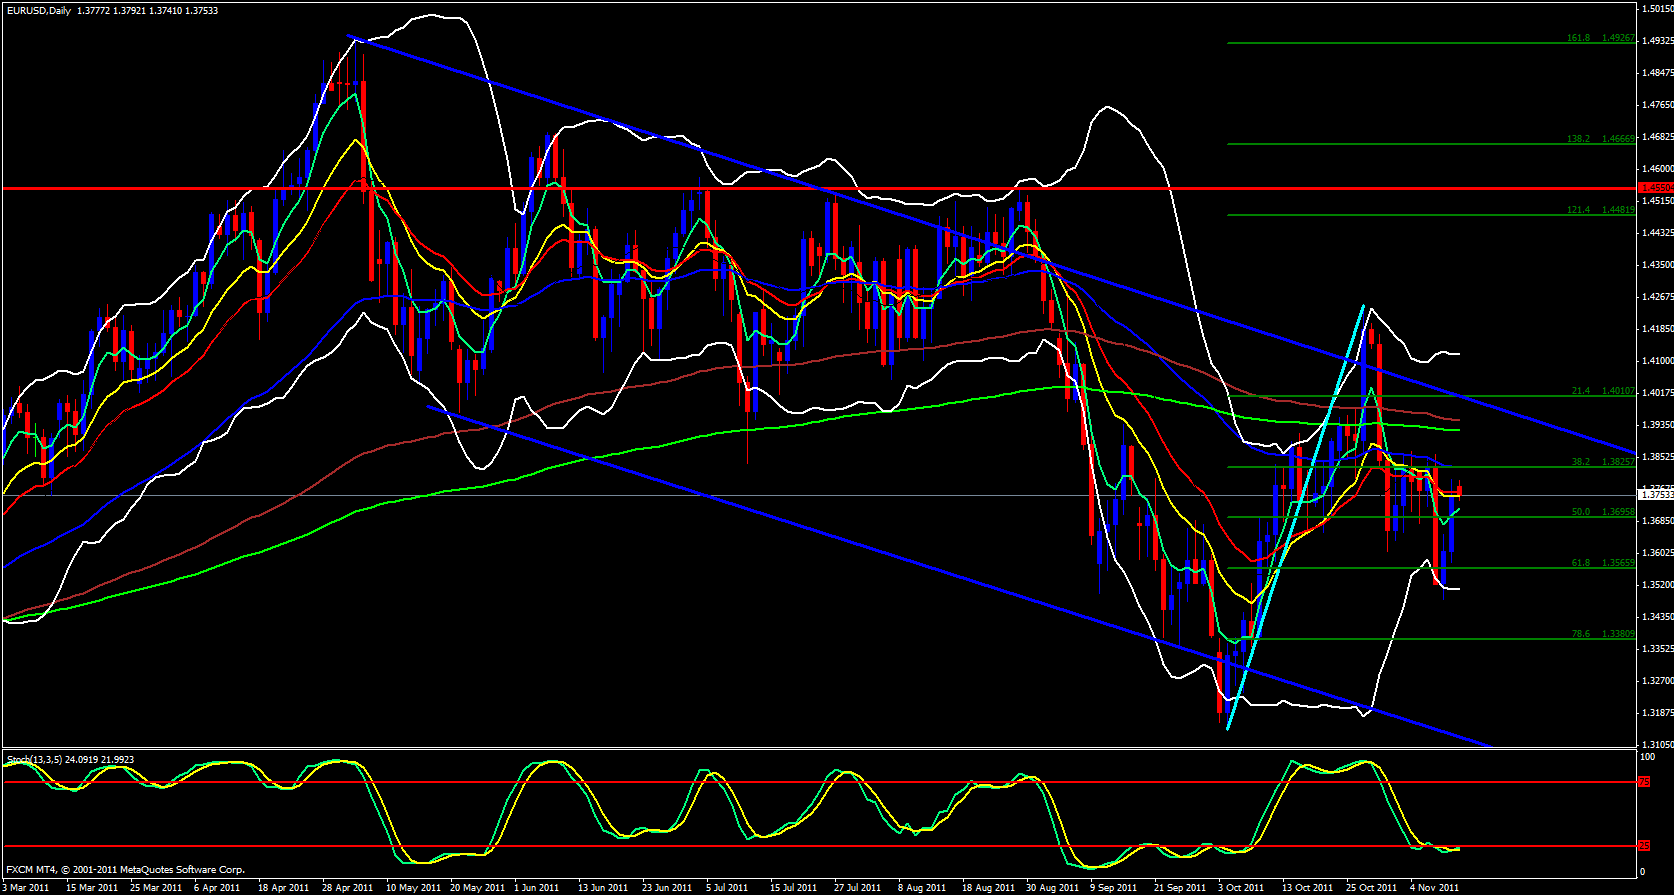
This pair looks a little strange to me today and only because it looks bearish on the weekly chart but the Swissy also looks bearish and the correlation between the two pairs is usually opposite so I will watch this pair very carefully. On the weekly time frame price has opened up below the 5 ema with the 5 crossing below the 144 and the stochastics is in the trade zone beginning to cross down, however, on the daily time frame price has bounced off the 61.8 fib to the upside and is currently above the 13 and 5 ema but sitting on the 13. Stochastics is also in the oversold zone.
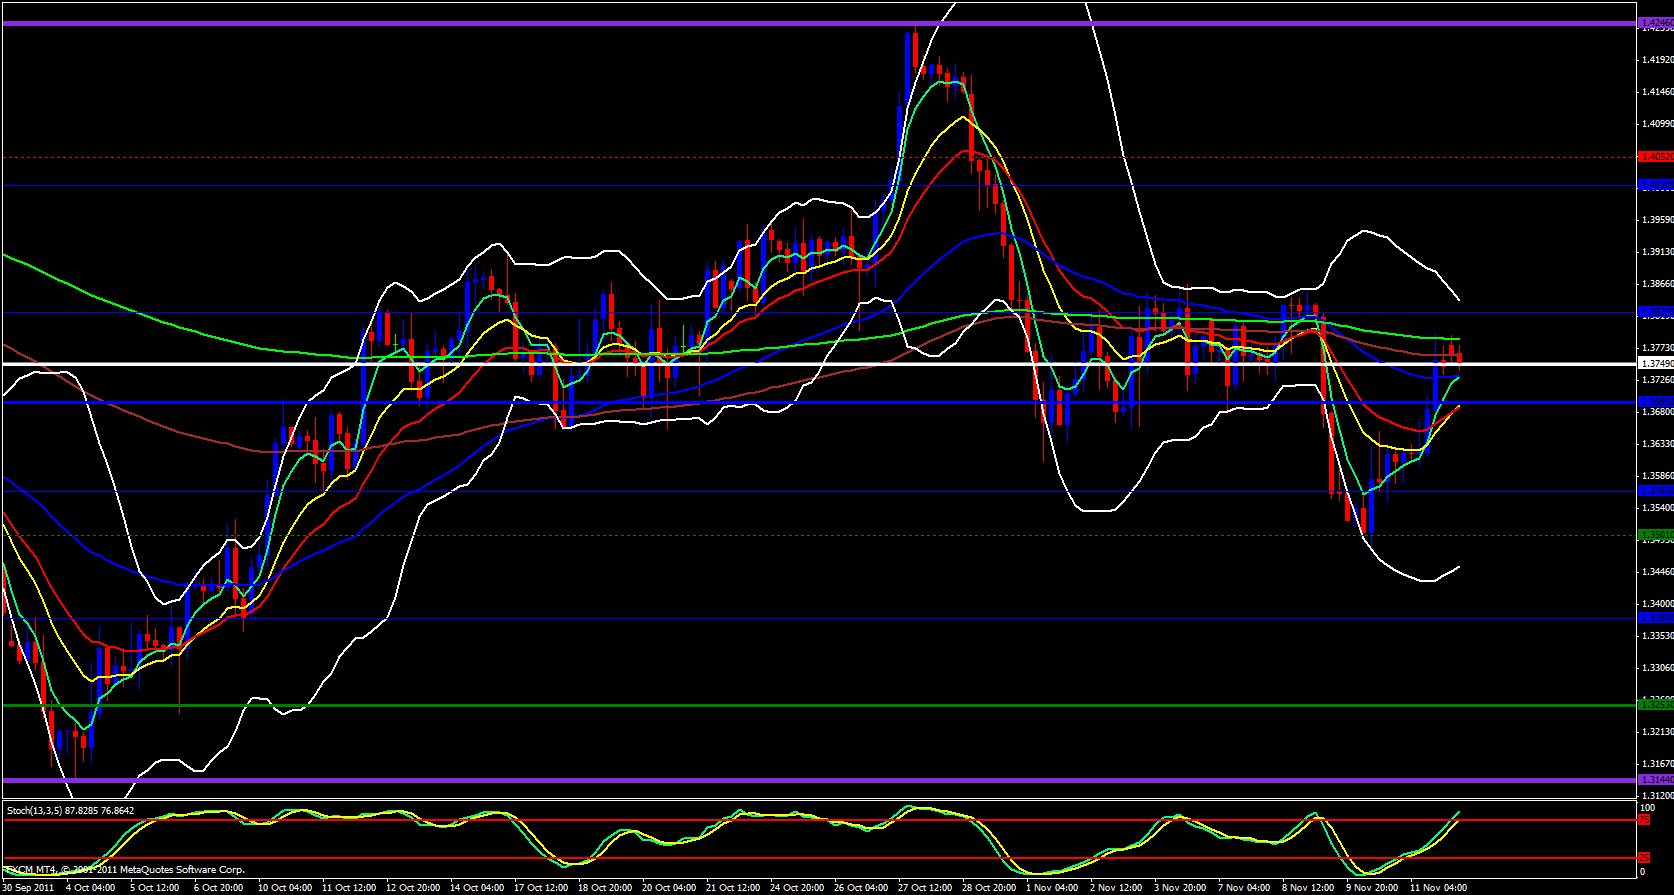
Moving on to the 4 hour time frame I can see that price has just bounced down off the 233 ema but has landed on the 55 ema and the 5 ema is heading up poised to cross above the 55. The 13 is also beginning to cross above the 21 ema and the stochastics is pointing up. Price also is currently sitting flat on the monthly central pivot point at 1.3749 and is overlapped with the 55 ema. Price has also retested the channel it broke out of last week and has even developed a spinning top precisely at the retest.
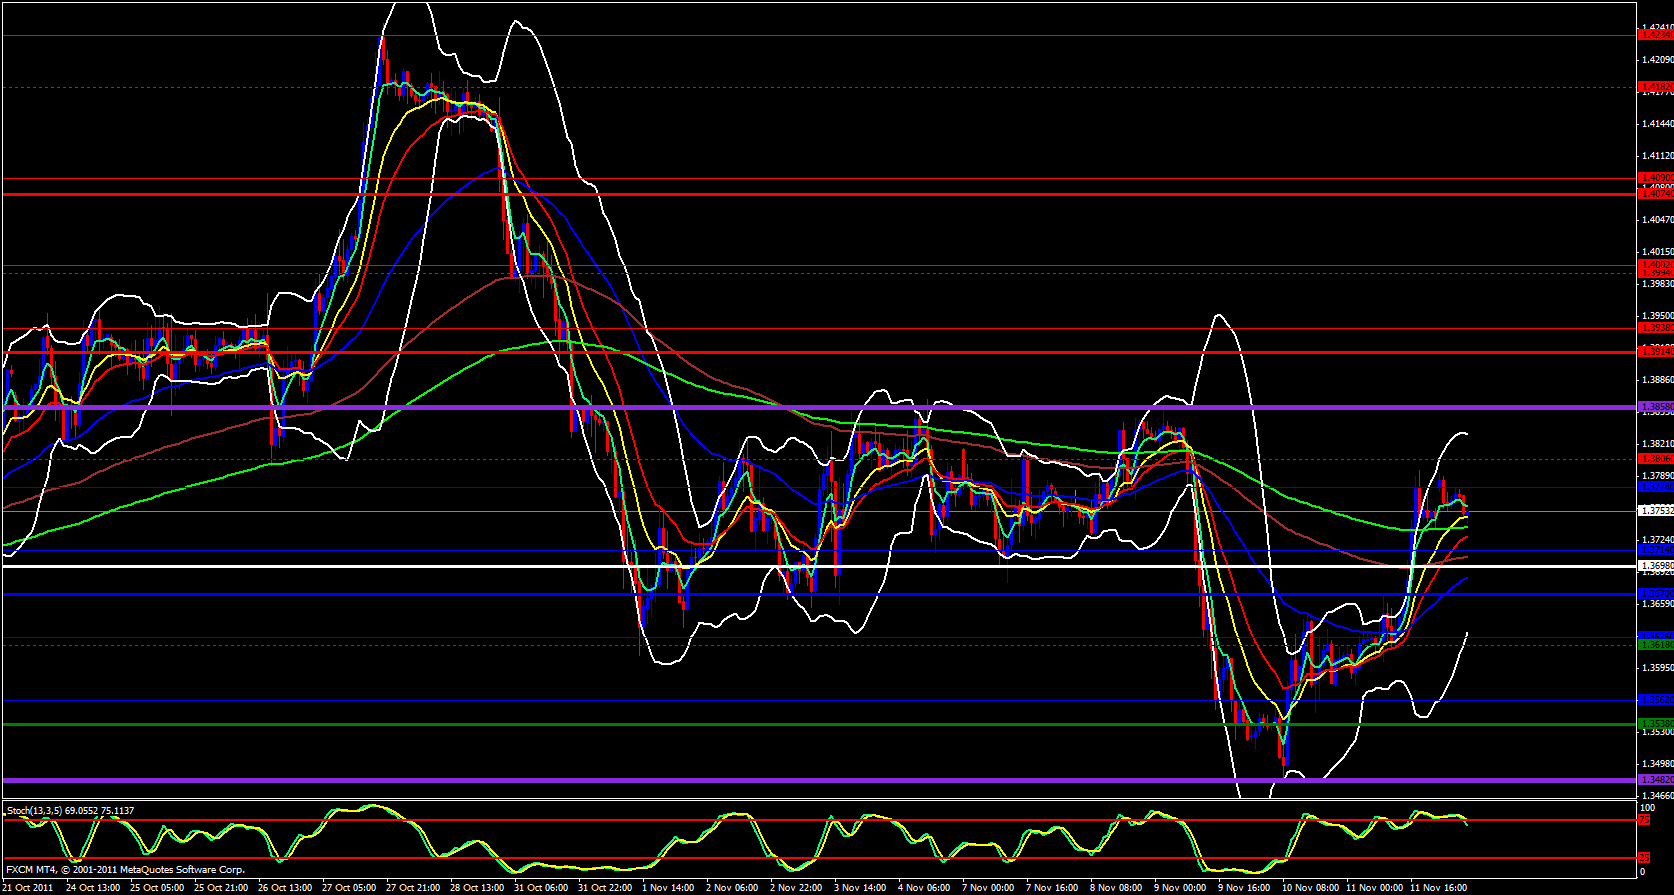
Moving on to the hourly time frame price also has a bearish appearance and the 5 ema is rolling over to the downside and the stochastics is also taking a dive from the overbought zone.
Finally, on the 15 minute time frame price has broken below the 55 ema and is riding down along the 5 ema and the lower Bollinger band is opening up to the downside. Price is just below the R2 daily pivot point at 1.3750 and also below the weekly M3 reversal pivot.


