By: Fadi Steitie
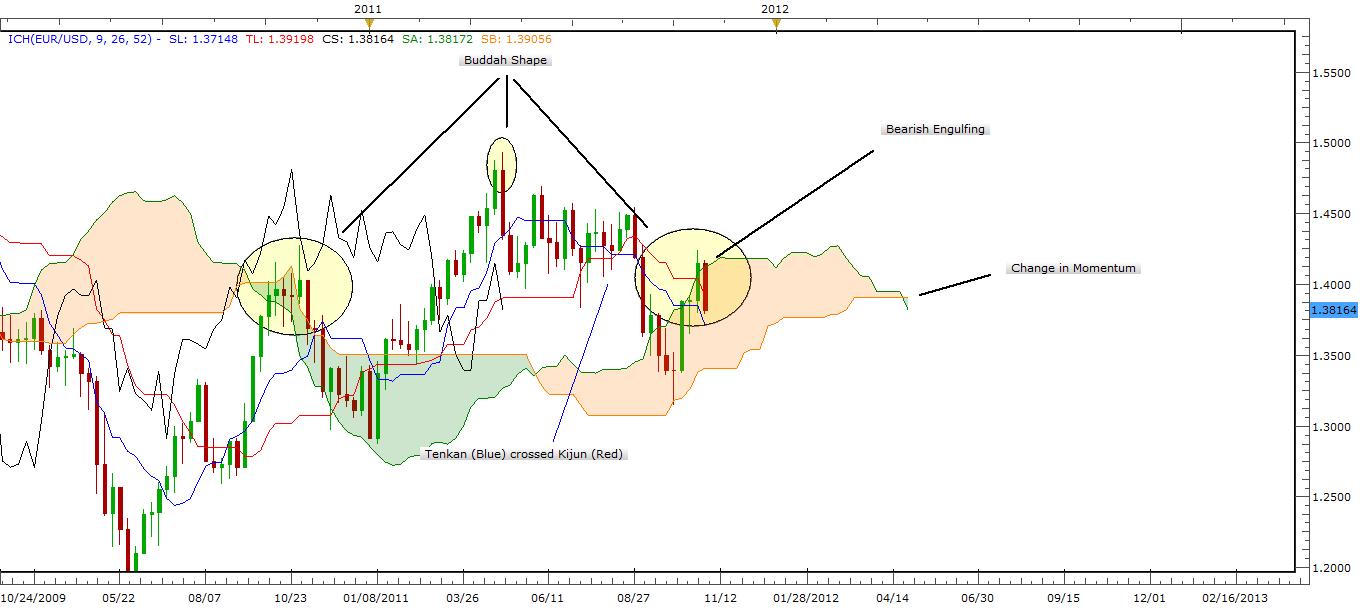
Looking technically at EUR/USD weekly chart with Ichimoku Averages, we again notice the Bearish overview of the Euro/Dollar pair from the Bearish Engulfing Candle shape touching the 26 day average within the cloud which indicates that the trend is still within a corrective stage. A cross in kumo 26 days dropped below 52 days shows increase in negative momentum. A Buddha shape with a cross in averages Tenkan (Blue) below Kejun (Red) tells us the above resistance force is strong.

If we look at hourly chart using Elliott Waves counting, we notice the previous trend ended at 0.618 fib (1.42500). A drop in trend with expectations of ABC Zigzag, Flat, or Triangle is on the way for this week.
Currency: EUR/USD
General Trend Expected Direction: Down
Minor Trend Expected Direction: Up
Strategy: Elliott Waves
Description: Expected an end of wave A soon and up to wave B at 0.5 fib (1.40170) and down again for wave C targeting 1.36385 to complete the ABC pattern. This is only an expectation of a ZigZag correction pattern. Soon will figure out if the correction is a Zigzag, Flat or Triangle.
Target Area: 1.36385
Stop Loss: 1.40670

.jpg)