By: Doug Rosen
The GBP/USD is just above the 78.6 fib level of the last move up. As I have said in the past the 78.6 fib level is very significant since it is the last fib level and the lowest risk level since you don't have to set your stop too far away.
Price is also spaced a ways from the daily 5 ema and needs to rise to it and make contact for it to continue to head downward.
Moving on to the 4 hour timeframe price seems to be slowly on the rise back up to the top of the channel it has been in for the last couple days.
On the hourly timeframe price has made a 38.2 fib to the downside and price is above the ema's, however, the upper Bollinger band is pointing down and closing in on price so this could be a rangebound day for the GBP/USD.
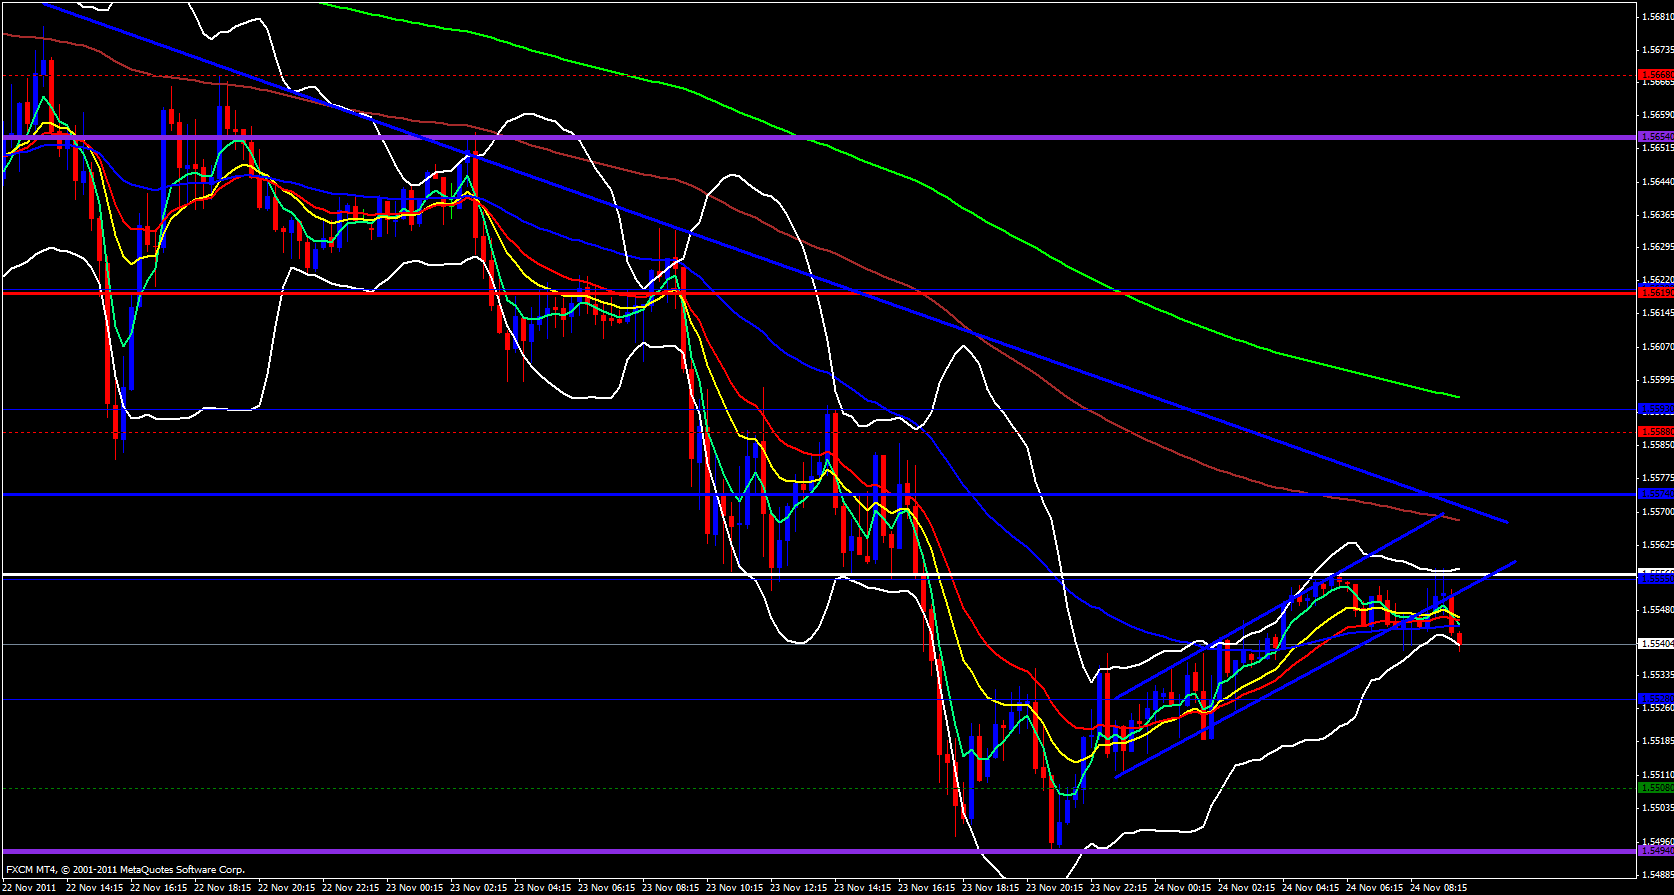
Finally, on the 15 minute timeframe the GBP/USD looks like it is faling. It has broken out of its price channel and has fallen below the ema's and the 5 ema is crossing below the 13, 21 and 55 ema's. The lower Bollinger band is beginning to open up and point down. I don't see any correlation with this pair since the Swissy is falling and if the Swissy is falling the GBP/USD should be rising.


