By: Doug Rosen
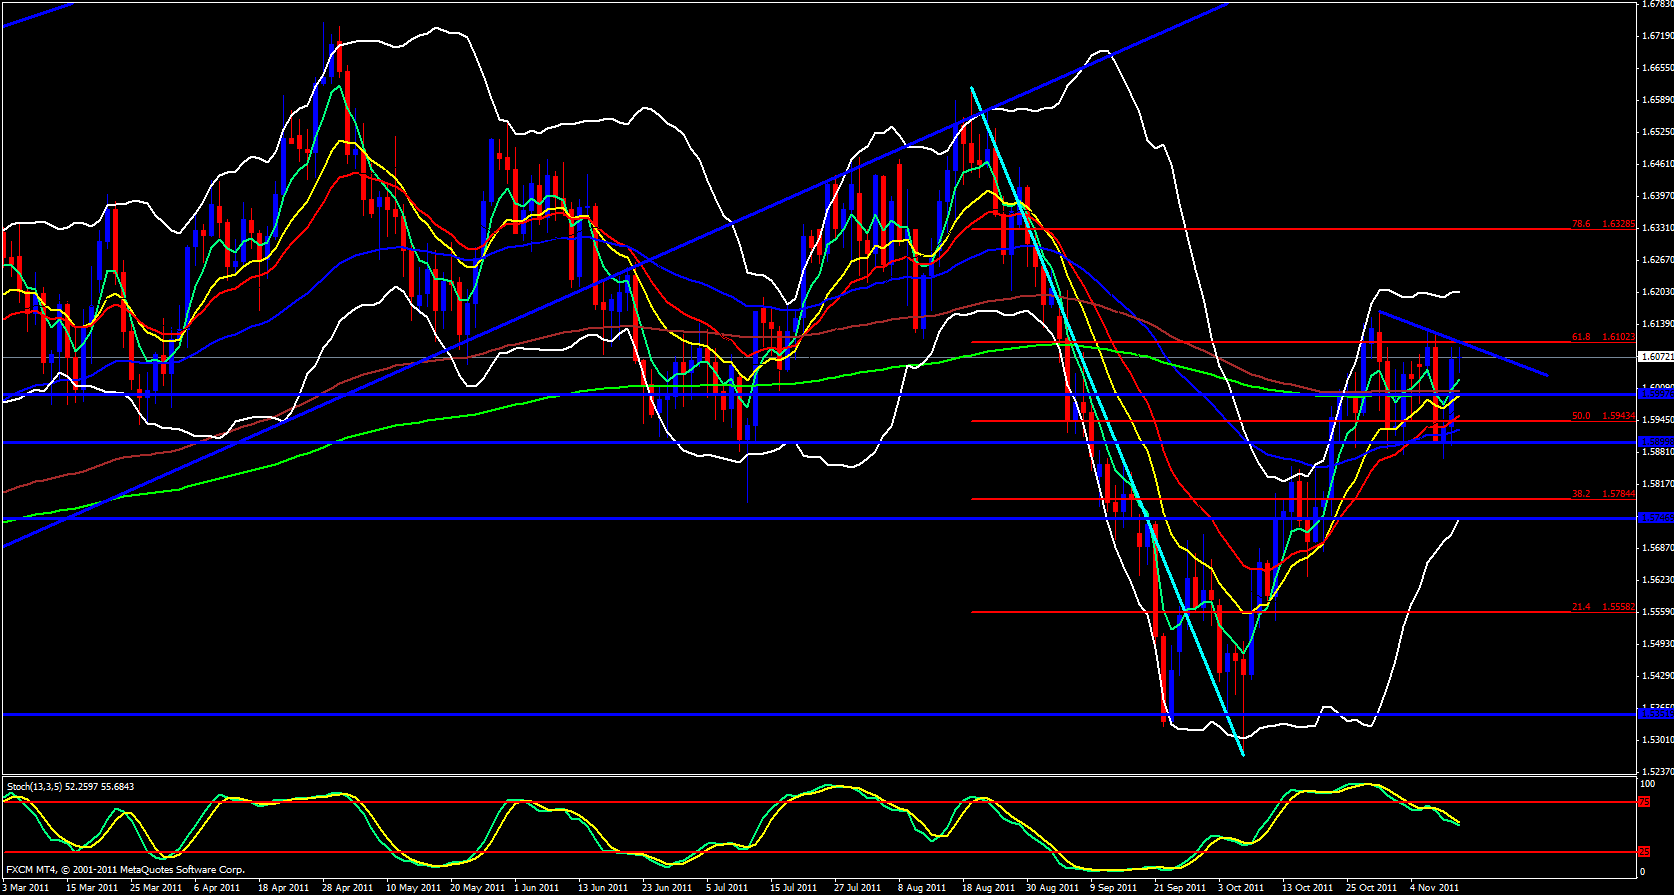
I will start out my analysis today on the daily chart. The weekly time frame just isn't telling me much today. On the daily time frame price has made 3 taps of the upper resistance line I have drawn and the stochastics is pointing down. Price also happens to be at a 61.8 fib level to the downside.
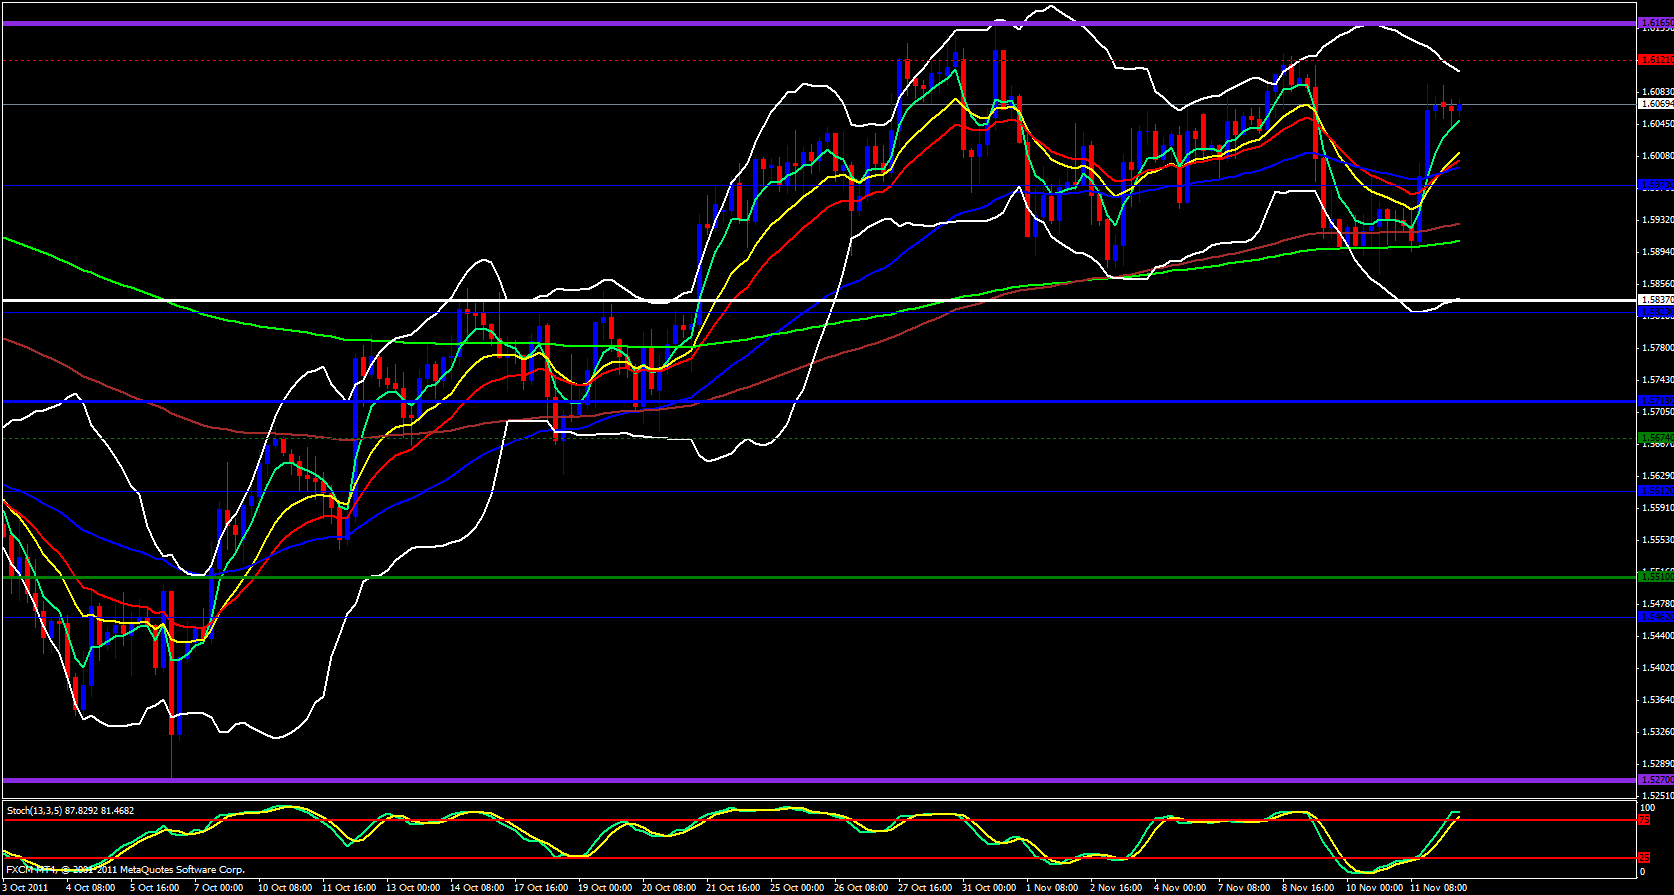
Moving along to the 4 hour time frame price is above the 5 ema as well as all the other ema's, however, it is nearing the upper Bollinger band which is closed and pointing downward. The stochastics is in the overbought zone as well.
Moving on to the hourly time frame price appears to be falling from the area it recently retested and may be heading down. Price has been making lower lows and lower highs.
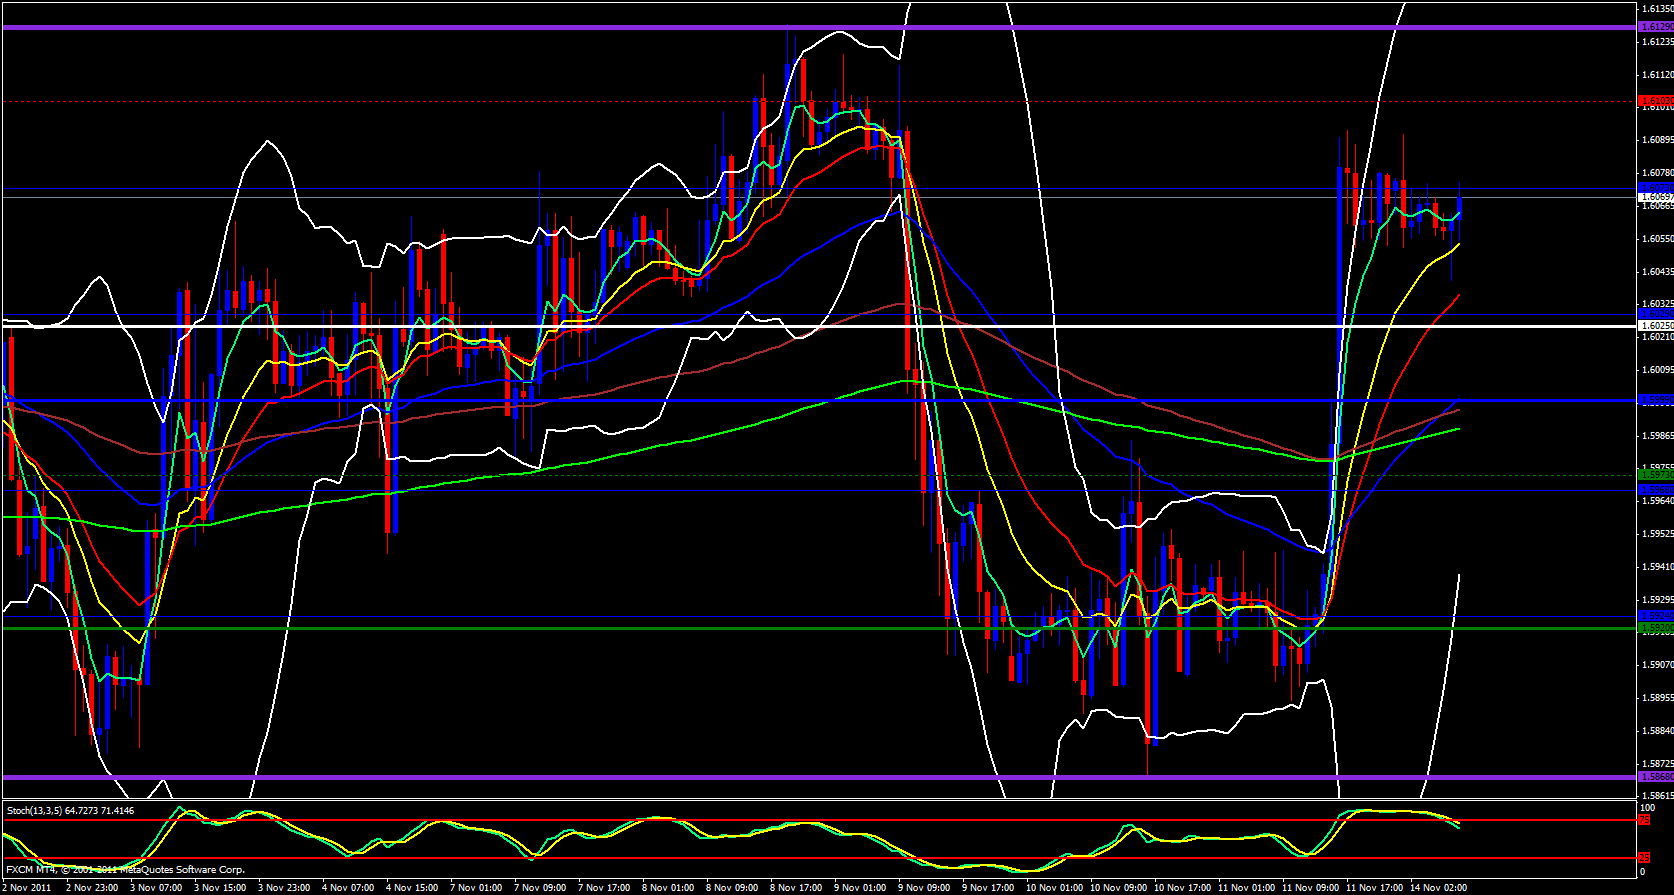
Finally, on the 15 minute time frame price appears to be ranging a bit but has still made a lower low from the range. This pair is not very predictable today. Price is just above the daily R2 pivot at 1.6044 and the weekly central pivot is at 1.6025 and just below the monthly M3 at 1.6121. My opinion on this pair is bearish but with weak conviction.


