By: Doug Rosen
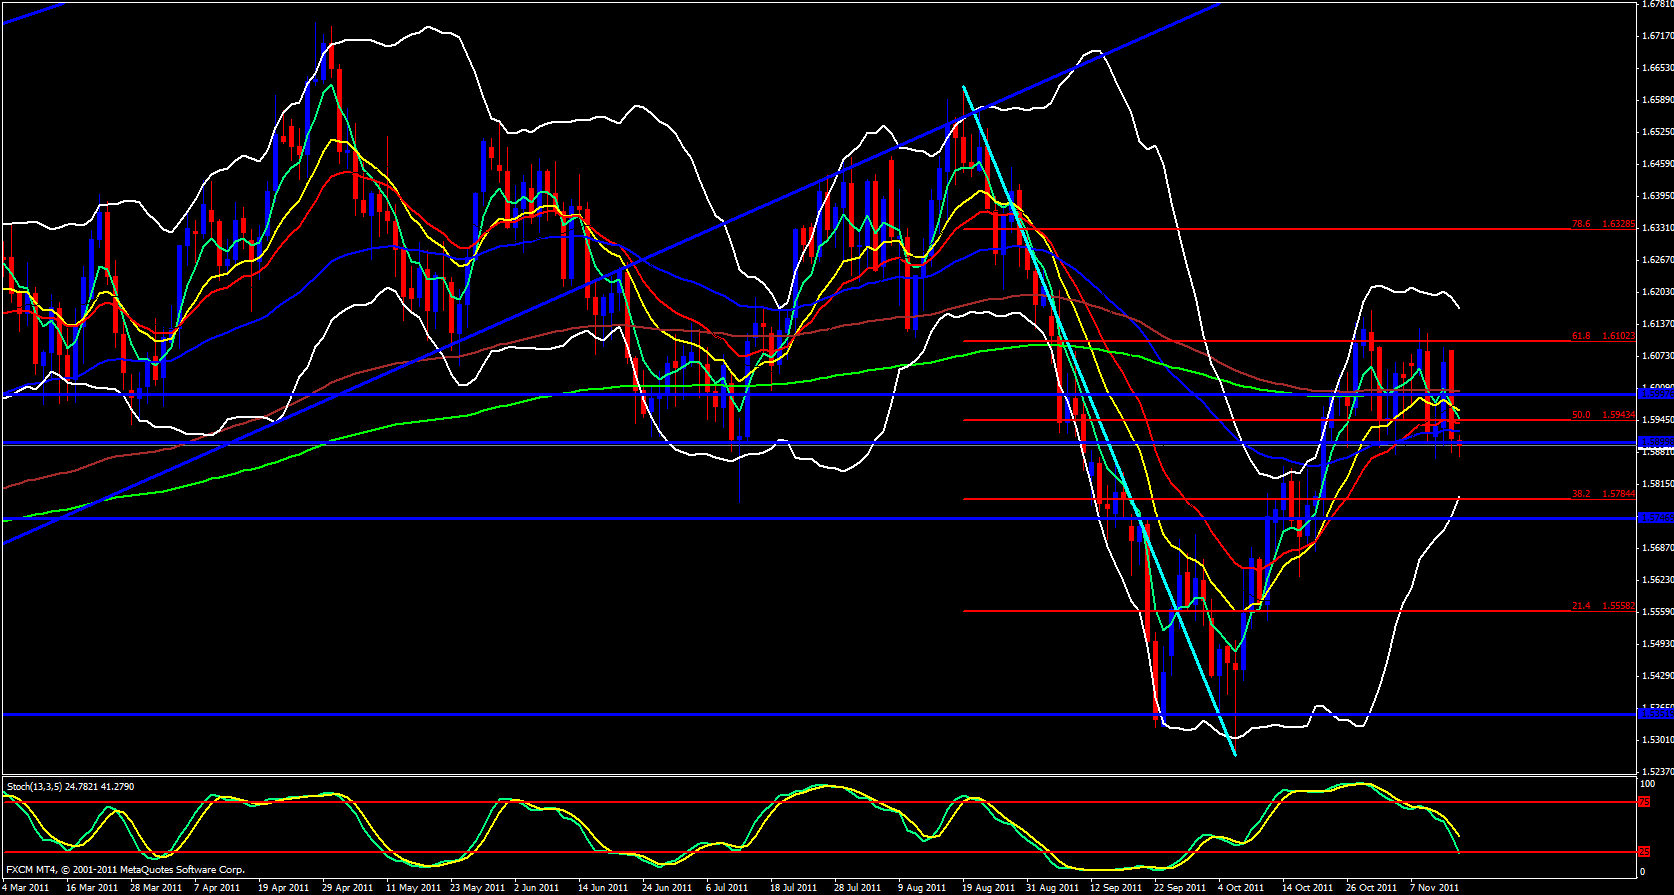
Yesterday was an incredibly bearish day for the GBP/USD. I guess the crowd realized they were not going to break the 61.8 fib level and the market just tanked. On the daily time frame this pair is looking bearish, however, the GBP has been stronger than the EUR and since the USD is picking up strength I am always all for pairing the stronger currency with the weaker currency.
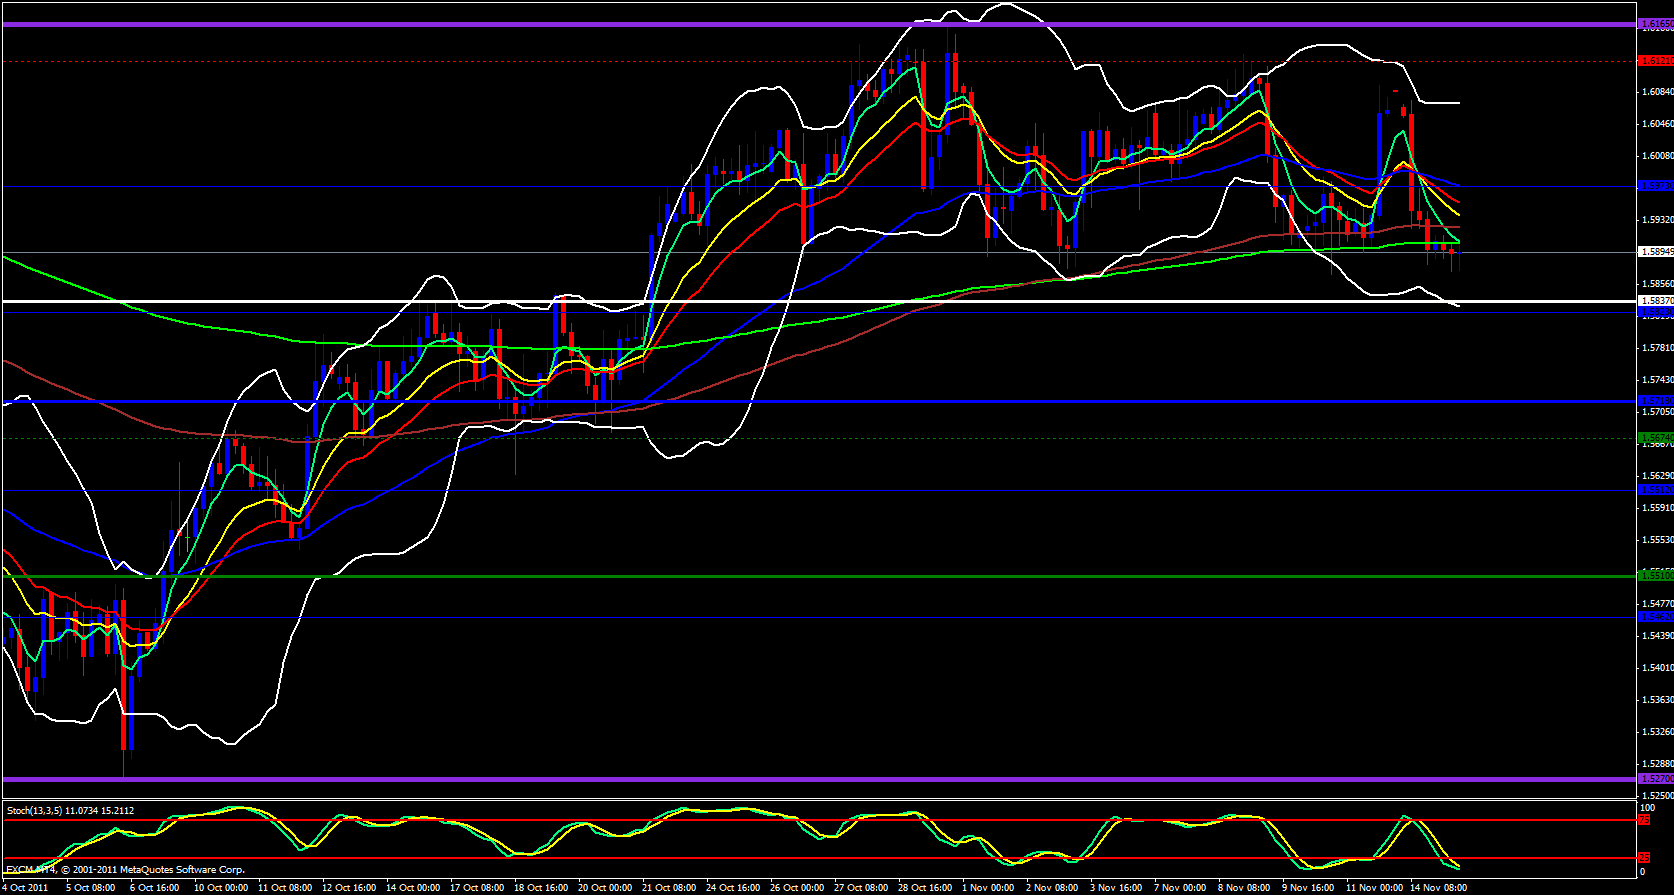
The 5 ema has crossed below the 13 and price is just below the 55 ema and the stochastics is pointing down, all very bearish signs to me, however, the lower Bollinger band is pointing up. The monthly central pivot point is the next monthly pivot point below price at 1.5837 and the weekly M1 pivot is at 1.5842 and the daily S1 is at 1.5827 and those areas are all within 15 pips of each other so a break below 1.5835 should inspire downward selling action. On the 4 hour time frame the 5 ema is approaching the 233 ema and has already crossed below all the other ema's, meanwhile the lower Bollinger band is beginning to open to the downside.
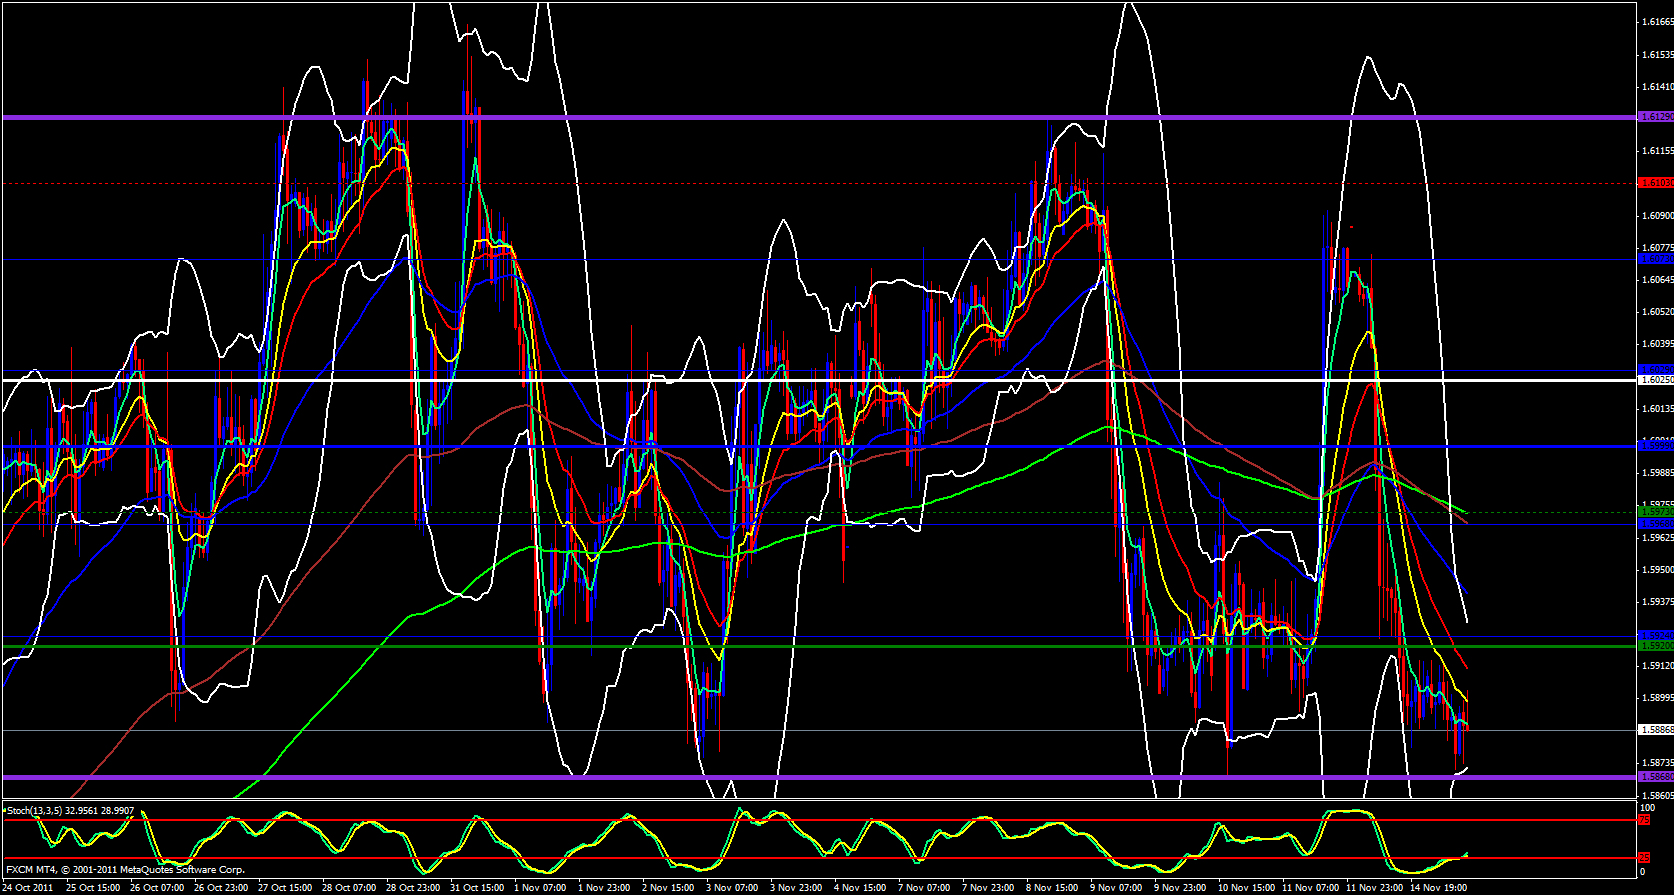
On the 1 hour chart I can clearly see that price is bouncing off last week's low and now retesting the 13 ema and may possible go to 1.5920 which is the weekly S1 and I expect it to find resistance at that level then continue to drop as well as offering a short entry.
Finally on the 15 minute time frame price is up against the 55 ema overlapped with the upper Bollinger band and this is where I expect price to get its first shove to the downside and then keep falling.


