By: Bastian Rubben
The holiday in Wall Street gives the major currencies opportunity to correct some of their declines against the USD. However, the correction is not that strong and the investors are waiting for the opening bell tomorrow. Analyzing the different charts of the pair GBP/USD helps to understand the intensity of the current bearish session in the market.
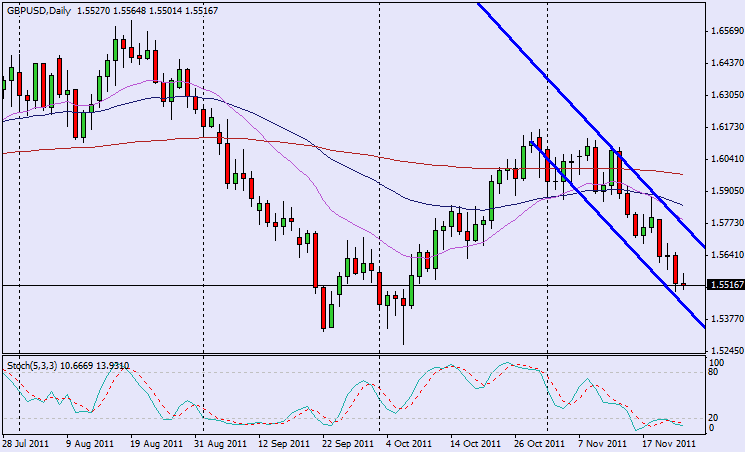
A negative signal for the pound appeared on the daily chart last week, as the 20 EMA crossed below the 50 EMA, which means that prices are getting lower. Many technical traders who spot the cross of the EMAs are getting prepared for additional declines and therefore most of the chances that we will see the pound shedding more points against the USD. The pair has been moving in a channel since the current session begun on October and reached the lower boundary of the channel, which means that the short-positions holders might cover their position and cause a correction from the current levels. However, the strong down-trend lives no doubts regarding the GBP direction and a break-down of the current support at 1.55 will open the way for the 52-week low at 1.527.
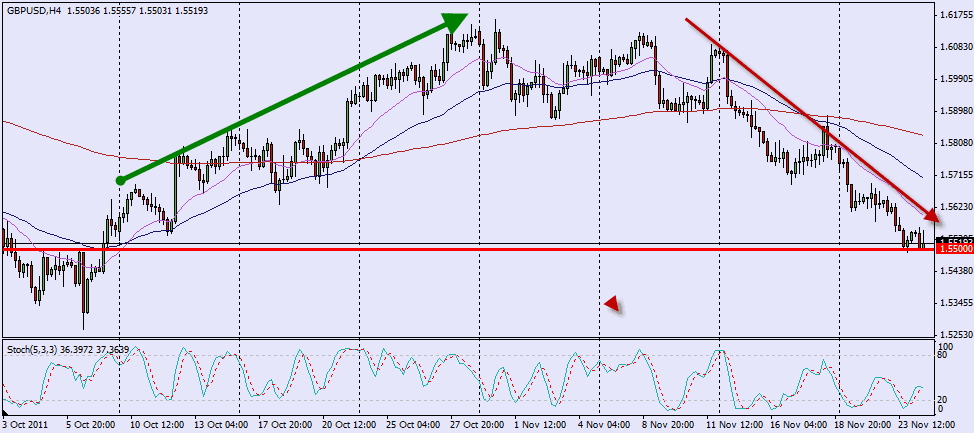
This can be seen well on the 4-hour chart of the pair. The “lower-highs” pattern started since the pair reached the pick at 1.617 and found the support at 1.55. The most interesting thing here is that the bearish session began after a strong up-correction that occurred on the previous months. The meaning of those events is that the buyers are currently out of the game and the sellers are on the upper-hand, even if the pair corrects from this point.


