By: Doug Rosen
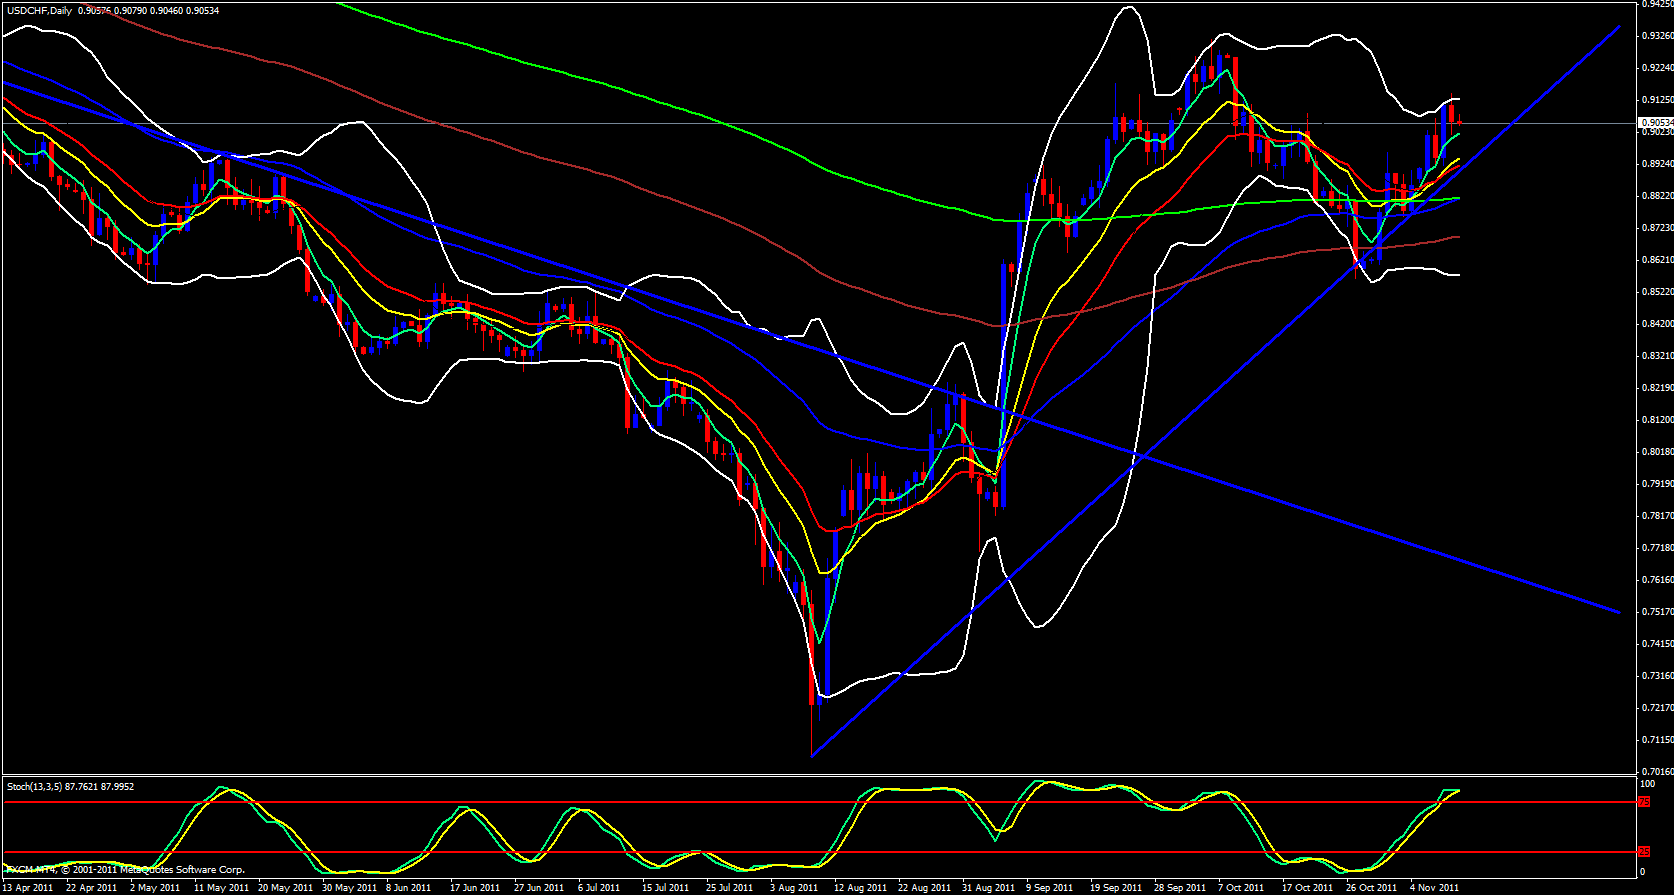
I will begin my analysis tonight for the Swissy with the daily timeframe. Price is riding the 5 ema to the upside and the Bollinger band is beginning to point up just a bit and the stochastics is pointing up.
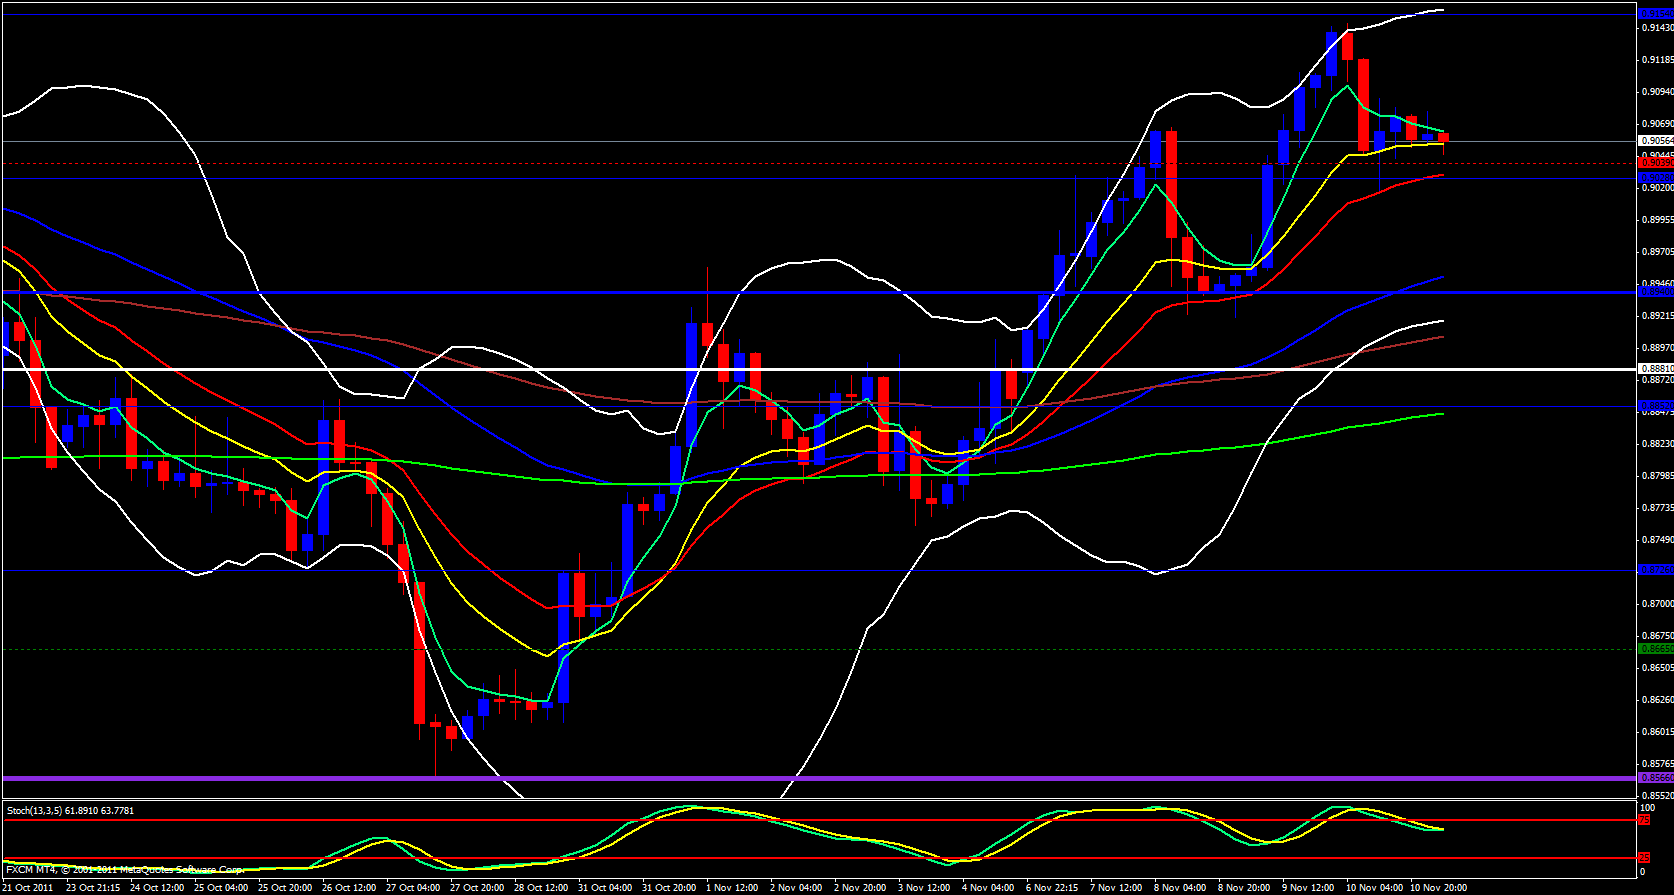
Moving on to the 4 hour chart price has had a series if higher highs and higher lows, a clear indication of an uptrend. Price has been coasting up the ema's and the 21 ema seems to be in control.
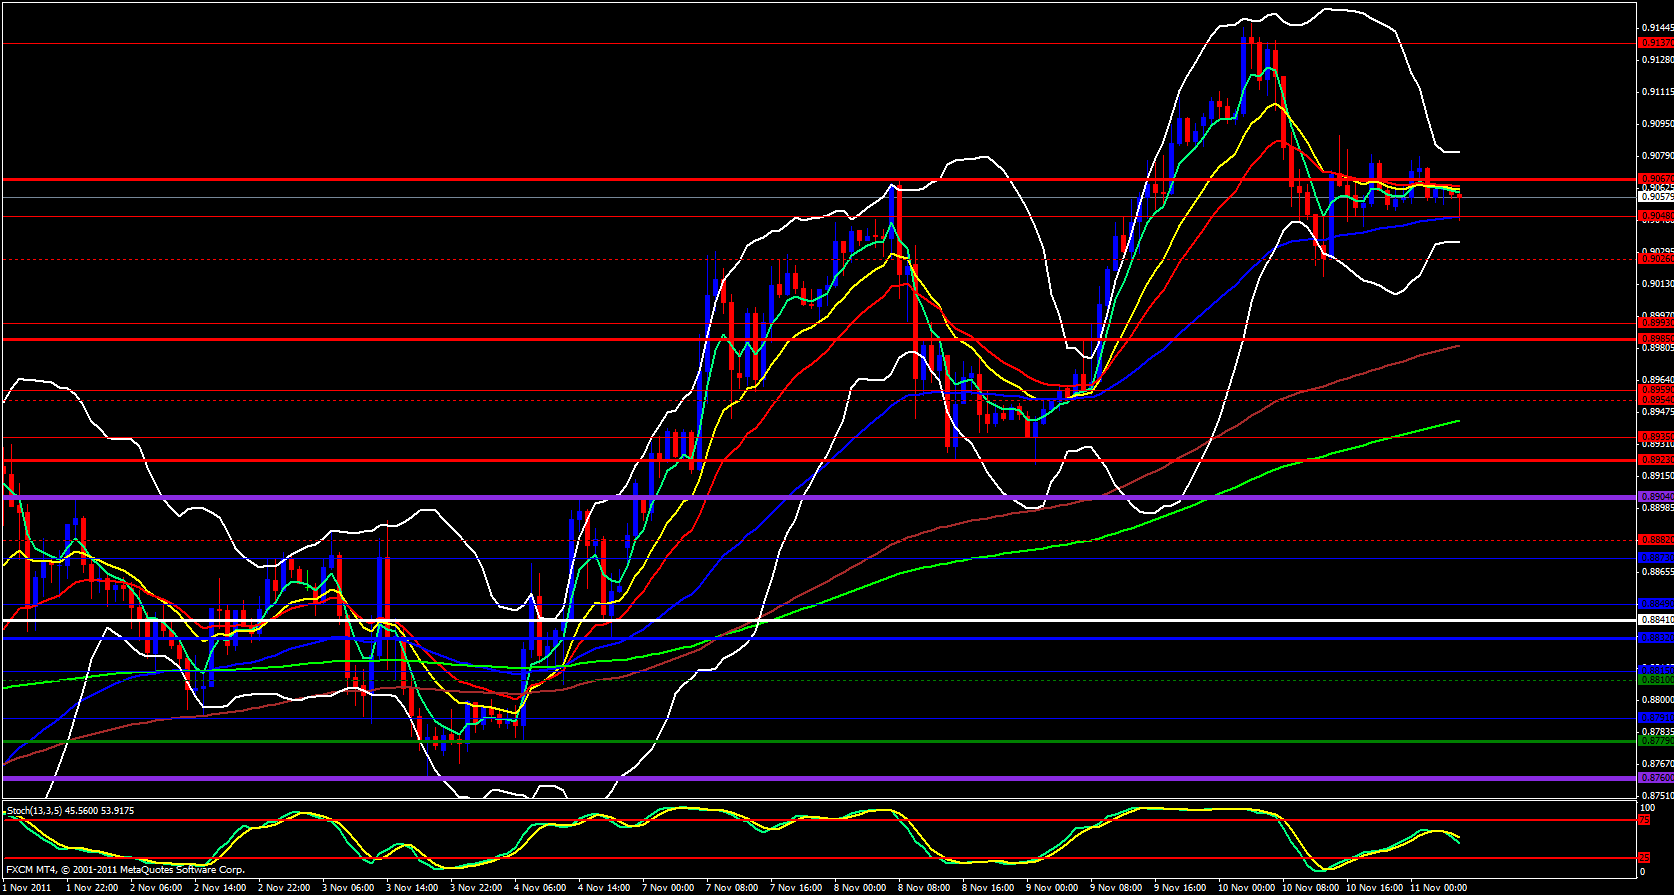
Moving on to the hourly chart price has fallen a bit and sitting on the 55 ma as well as an inclining trend line.
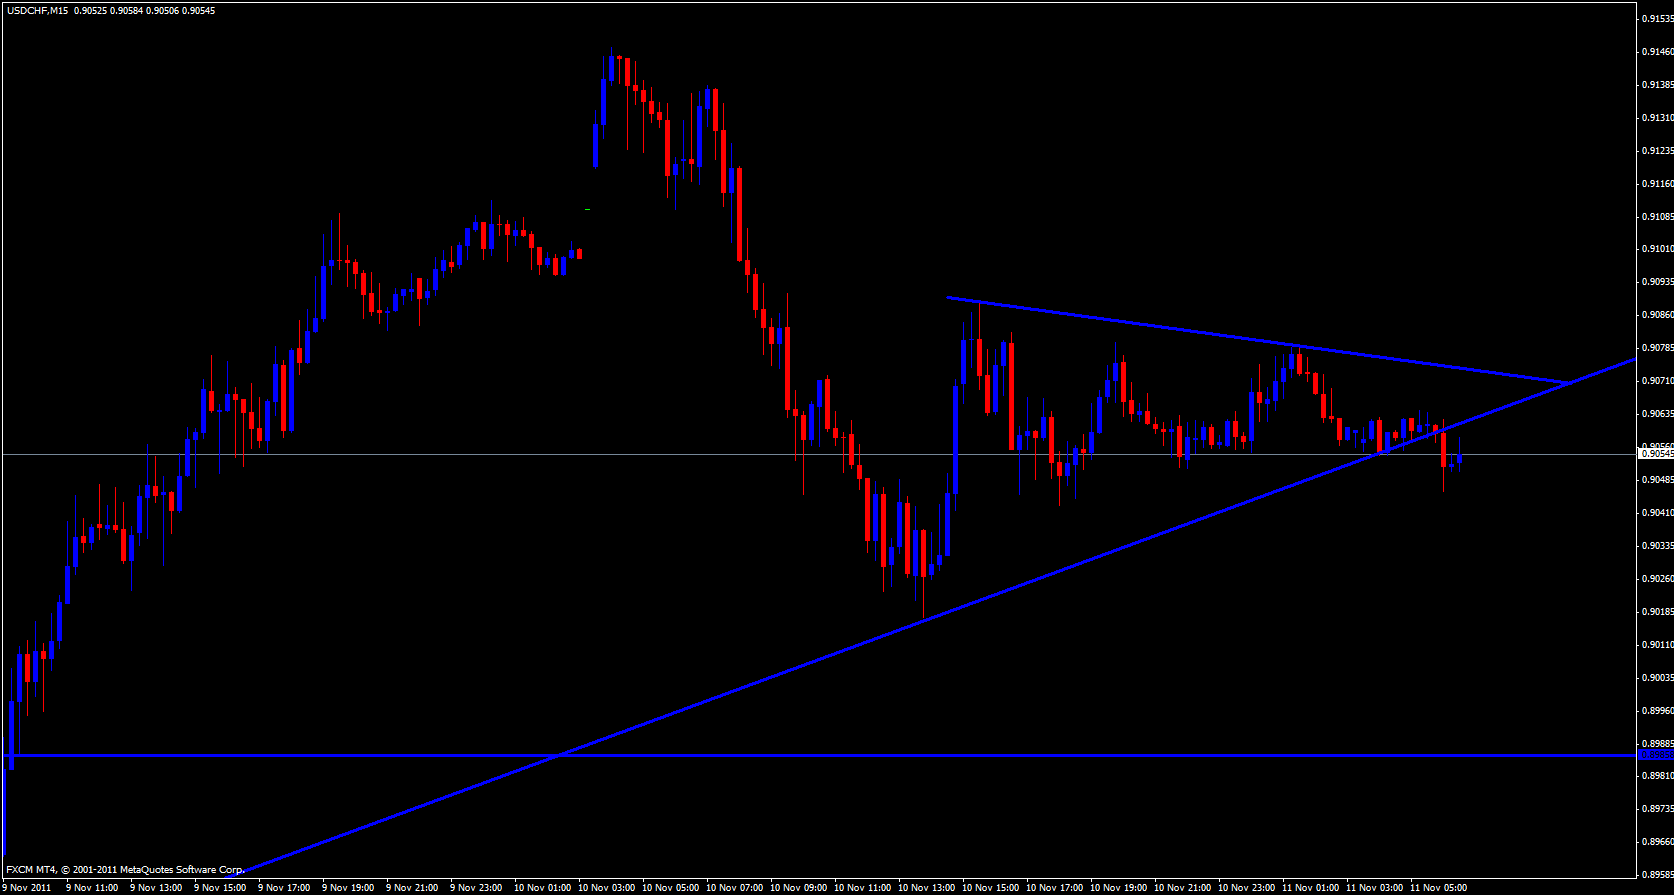
Finally on the 15 minute timeframe Price has broken out of a price trap it was confined in to the downside. We have to watch this carefully since this can be a fake out since sometimes breaks out from one direction then suddenly takes off the other direction and reverses.
Price is below the 5 ema but approaching the 233 ema and the lower Bollinger band. Price is below the daily Central pivot point at .9074 as well as the weekly R3 at .9067 .


