By: Doug Rosen
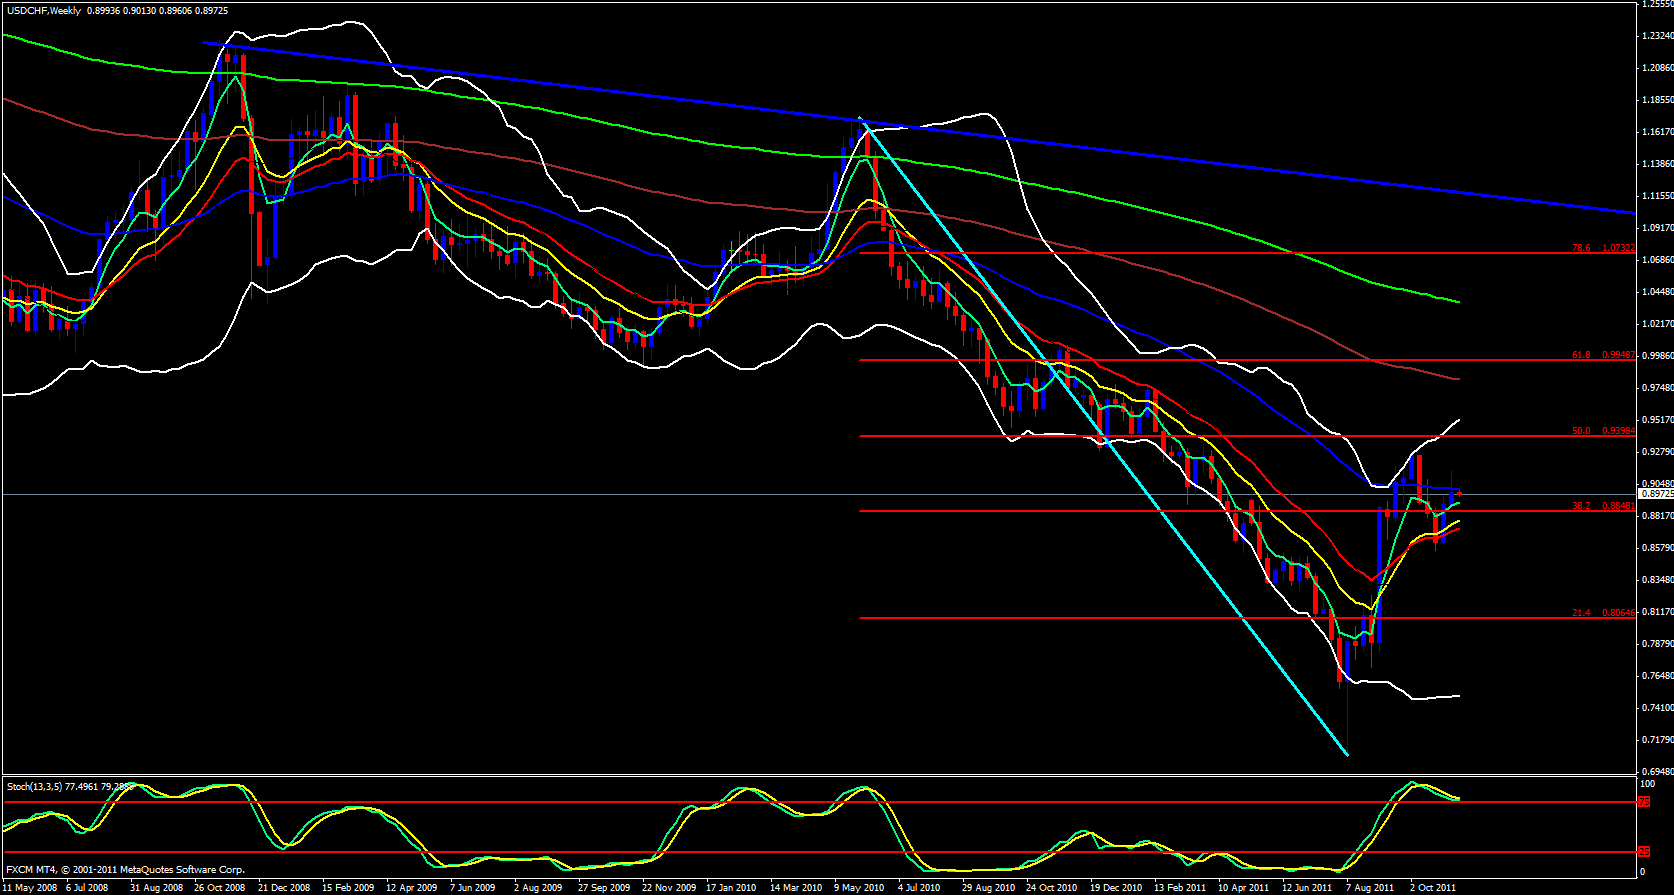
For all practical purposes, the Swissy is looking bearish to me. Mostly because it has a lot of resistance it its way. Beginning my analysis with the weekly time frame I can see we have been in the same fib zone for a several weeks now. Price came close to the 50.0 fib level, was then rejected and fell below the 38.2 level, but met up with the 13 and 21 ema and was pushed upward. Last week however, price did not make it back up to the 50.0 and is currently up against the 55 ema and the stochastics is coming out of the overbought zone and beginning to cross down.
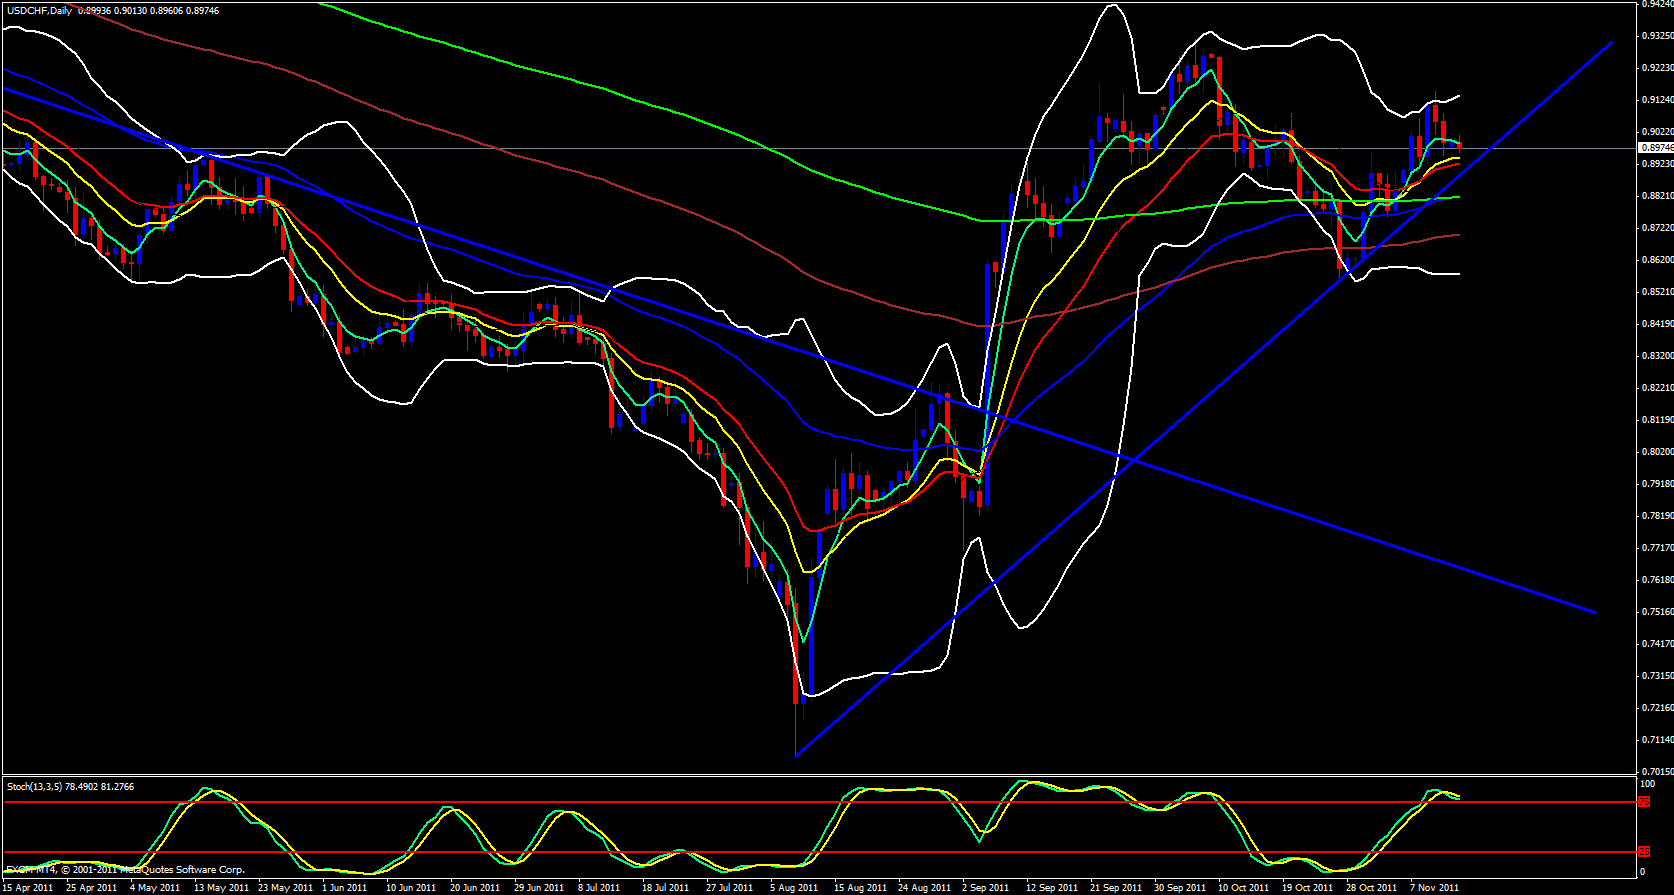
Moving on to the daily time frame price is right up against the 5 ema and the 5 ema looks like it could roll down soon since it is nearing the 13 and 21 ema's. Stochastics is also in the overbought zone for this time frame. Conversely, the 13 and 21 ema's as wll as the upper sloping trend line could very well act as support and cause price to bounce up. This trend line will help us to know what will happen since a break below this line will be very obvious.
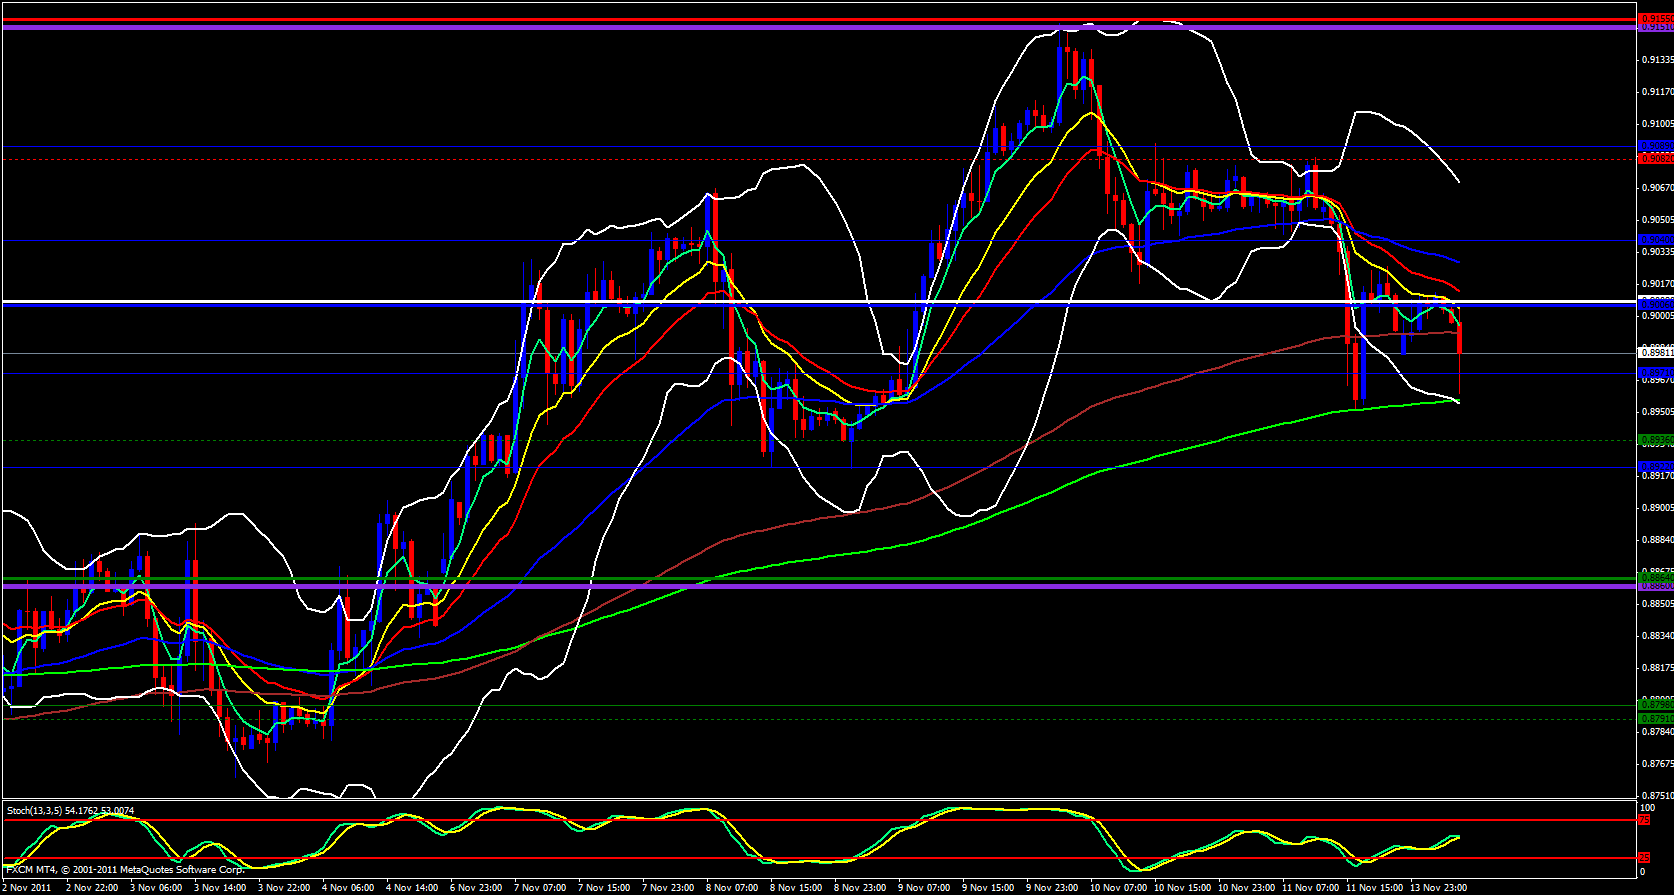
Moving on to the 4 hour time frame price has broken its trend line to the downside. Price is also riding the 5 ema to the downside, however, it is approaching the 55 ema overlapped with the lower Bollinger band and a stochastics in the oversold zone, very bullish indications indeed.
Moving on to the hourly time frame price is riding the 5 ema down and has busted the 144 ema but is approaching the 233 ema overlapped with the lower Bollinger band on this time frame and this coincides with the 4 hour 55 ema so a reactionary bounce is definitely imminent at that level. Price is currently below the daily central pivot as well as Fridays low. Price is also below the weekly central pivot point.


