By: Fadi Steitie
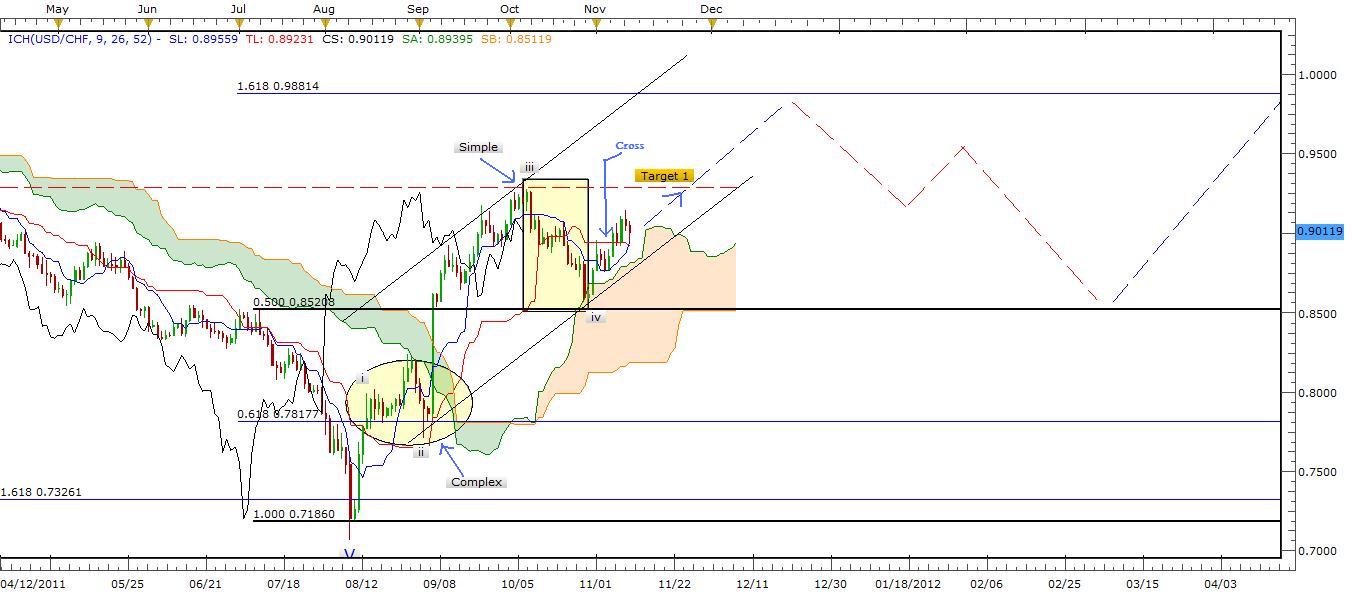
A technical glance at the daily chart for USD/CHF using Ichimoku
Kinko Hyo averages, we can notice that trend had touched Senkou span A 26 days (Green Moving Average) and bounced crossing Kijun-Sen (Red) just above Kumo (Cloud) which indicate a positive move in a trend following system. It seems wave iv ended once it touched the cloud and going toward final wave five. In case wave four still in progress, we know that it shouldn't go below 0.382 fib level (0.89500 Price level) where I am going to place my stop lose in this trade.
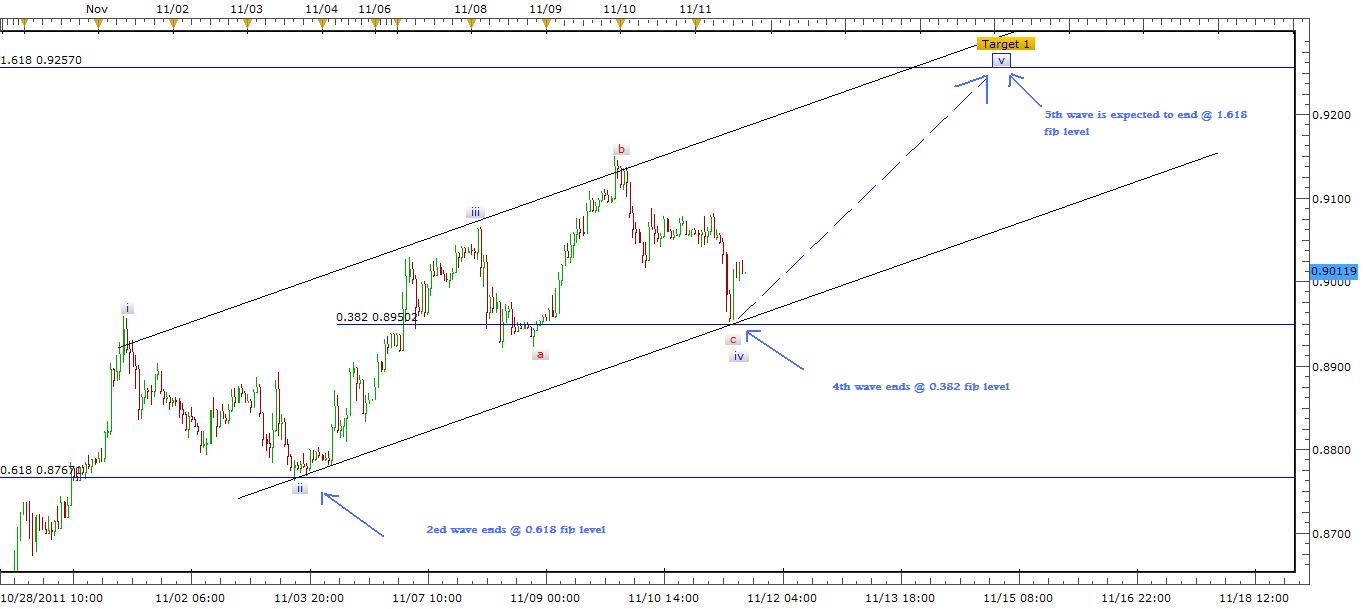
Now I will go into a little more details in hourly chart by using Elliott waves and
Fibonacci levels where we can notice how wave ii ended at 0.618 fib level with a double ZigZag correction and wave iv landed at 0.382 fib level with a complex correction. If this channel trend will behave in Fibonacci relationship, I would go long targeting initially 1.618 level at 0.92570.
so I suggest the following trading strategy:
Signal: Hold long (Buy)
Strategy: Elliott Waves
Description: Wave v is going to unfold and progress toward our target level or might go further in a more complex corrections but shouldn't dip below pivot point at 0.89500.
Target: 0.92550
Stop Loss: 0.89120
Trade expected Duration One Week to Ten days.


