By: Christopher Lewis
EUR/USD
The EUR/USD is a pair that has been at the epicenter of the storm in the Forex markets as of late. Looking at the pair, you can clearly see a massive hammer that has formed on the weekly chart just above the 1.35 level. While this in and of itself looks very bullish, there is a severe lack of clarity in this pair presently. Also, one has to temper the bullishness of Friday’s action with the fact that the US session was a holiday one. Looking at the pair, there is clearly resistance at the 1.40 area, and as such it appears that although the next move may be up, the bullishness may be somewhat hampered. The most likely scenario: More consolidation between 1.40 and 1.35 or so.

AUD/USD
Looking very similar to the EUR/USD, we see that the weekly candle in AUD/USD is a hammer as well. The parity level has held up as support again, and the Aussie enjoys the benefit of being a “risk on” currency, so it makes sense that we saw a large bounce later in the week. The hammer looks tempting, but as you can plainly see, the 1.05 is a serious are for resistance. The 1.07 above is the top of major resistance, and in order to get massively bullish, we would have to see a close above that level. In the mean time, expect headlines to push and pull this pair over the next week and beyond. If we could close on a daily chart below parity, this pair becomes a massive sell at that point.

USD/CAD
The USD/CAD has been greatly influenced by the oil markets lately, and it appears that the usual correlation holds true as of late: as oil rises, so does the value of the CAD and vice versa. With this in mind, the most important thing to know is that the Light Sweet Crude markets are a $99, which means $100 is next – and it is massive resistance. Profit taking will more than likely occur there. The parity level is just below in this pair, and has been very supportive in the past. (Down as far as 0.99 as well.) Both the CAD and oil have limited upside, which means this pair probably falls for a little bit, only to return to consolidation between 0.99 and 1.03 in the end. If oil breaks out, this pair breaks down below 0.99 and onto 0.9450 or below.
.png)
EUR/CHF
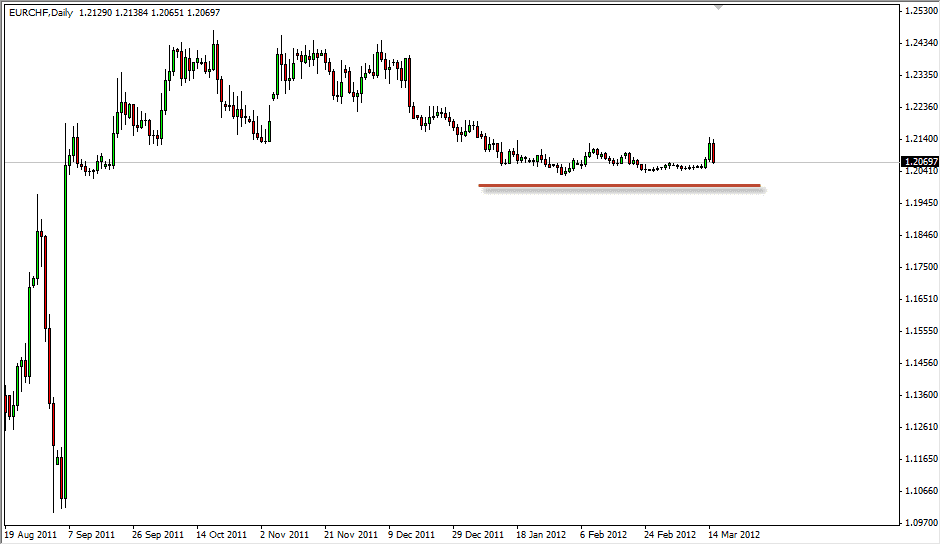
EUR/CHF had a bullish week, and is presently testing the 1.24 level. This is the start of a resistive “zone” going all the up to 1.25 as well. This area is massively important as it was the beginning of the true “meltdown” of support in this pair. The SNB has declared 1.20 as the “floor” of this pair, so selling isn’t desirable. However, if we can get above that 1.25 level, this pair suddenly becomes a long-term buy, with the savvy trader more than likely being able to hold onto it for months, if not years.

GBP/USD
The cable fell again this past week, only to pop back up during the thin Friday session in America. The massive parabolic move during that session has this pair forming a hammer at the 1.60 level for the second week in a row. The area is a massive support and resistance area, and the fact that buyers keep stepping in suggests that we will go higher from here. The next resistance area is found at 1.65, and that is very likely where we head next if we can get positive motion on Monday. However, the cable is highly sensitive to headlines, so choppy conditions with an upwards bias might be the theme of the week.
.png)

.png)