By: Doug Rosen
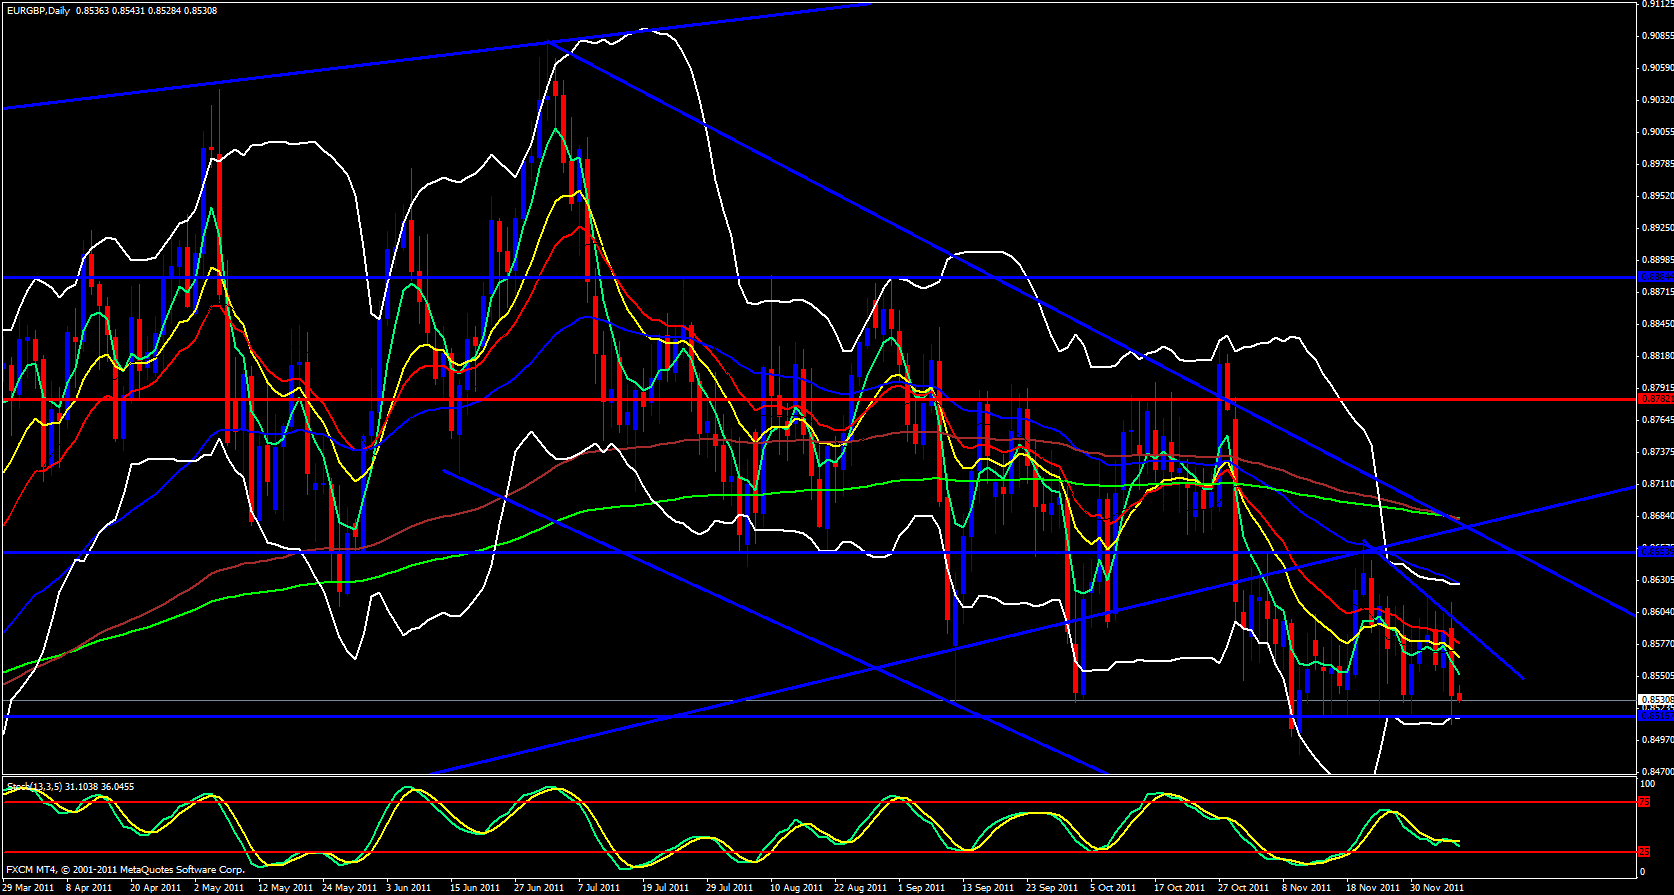
The EUR/GBP starts the new day off just above a visual support zone at around .8518 Price has not been able to close below this level since earlier this year. It may have pierced this level a couple times but hasn't really closed below with one exception last month where it closed below but bounced right up and keeps bouncing off it every time it touches it.
The daily lower Bollinger band is also overlapping with this area and the band is not open. On the weekly time frame the 144 ema is just above this zone and price has not been able to close below this ema or at least stay closed below it for a long time.
Also, on the daily time frame price is a bit below the 5 ema and the new daily candle has not touched the daily 5 ema just yet and price has to rise up and make contact with the daily 5.
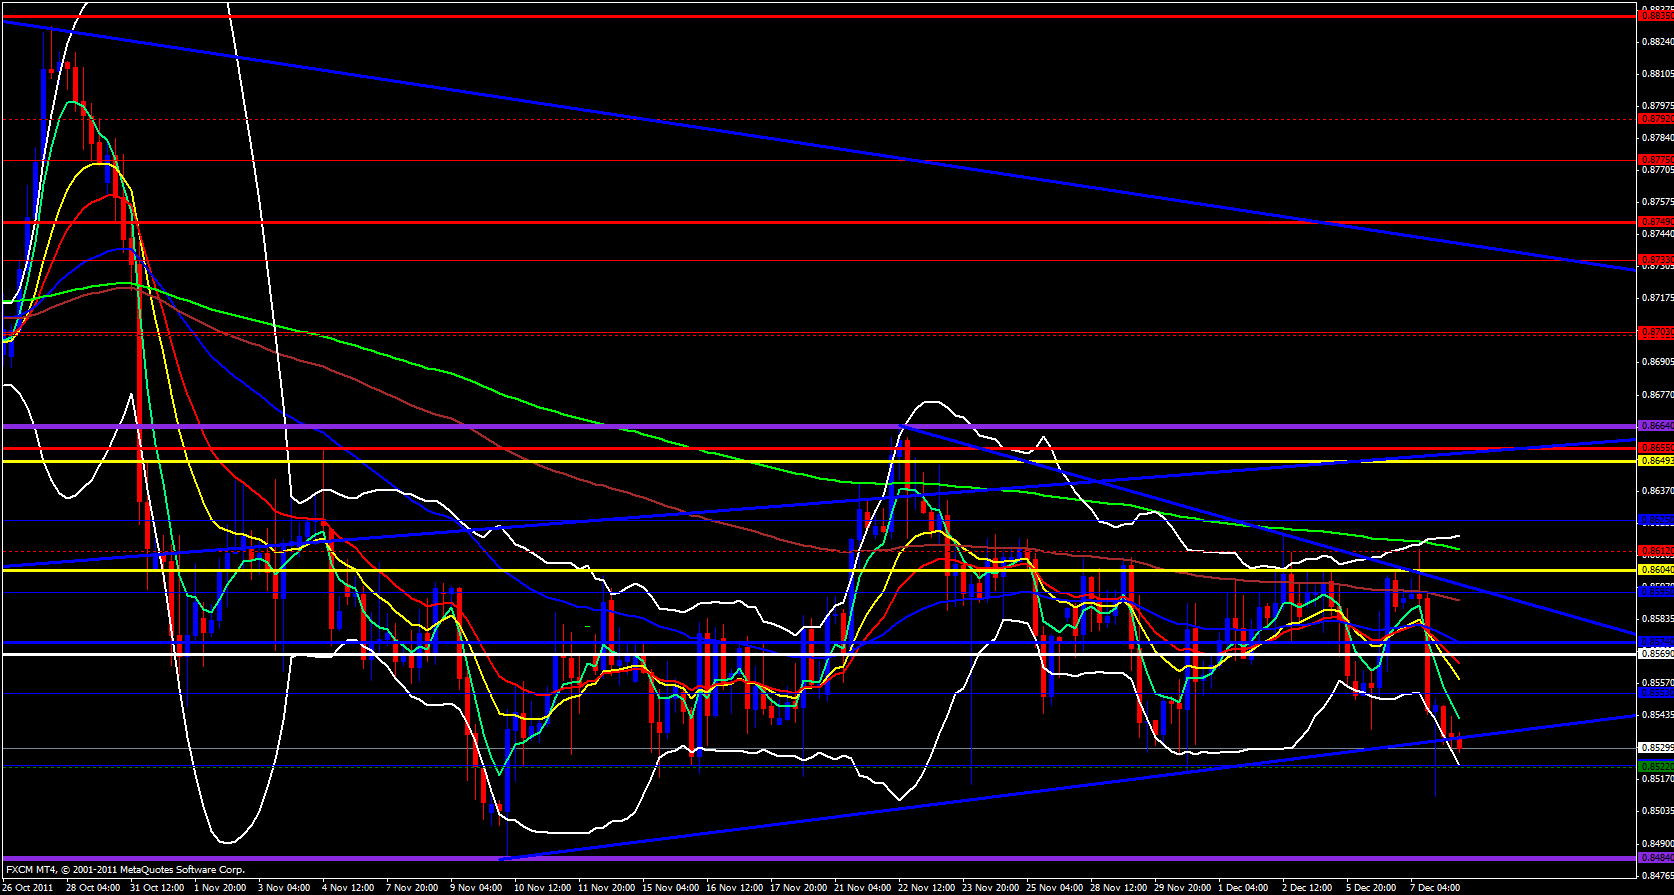
Moving on to the 4 hour time frame price has pierced below the triangle price trap a bit, however, based on all the support that lies below I don't think this will be a breakout but maybe a fake out. Many times I have seen price break out below or above a triangle price trap only to snap back in and even keep going the other way. This could very well be the case. .8522 is also the monthly M2 reversal pivot. Price has also moved ahead of the 4 hour 5 ema and price will sooner or later have to head up and touch the 5 ema even if it is going to keep heading down and break support.
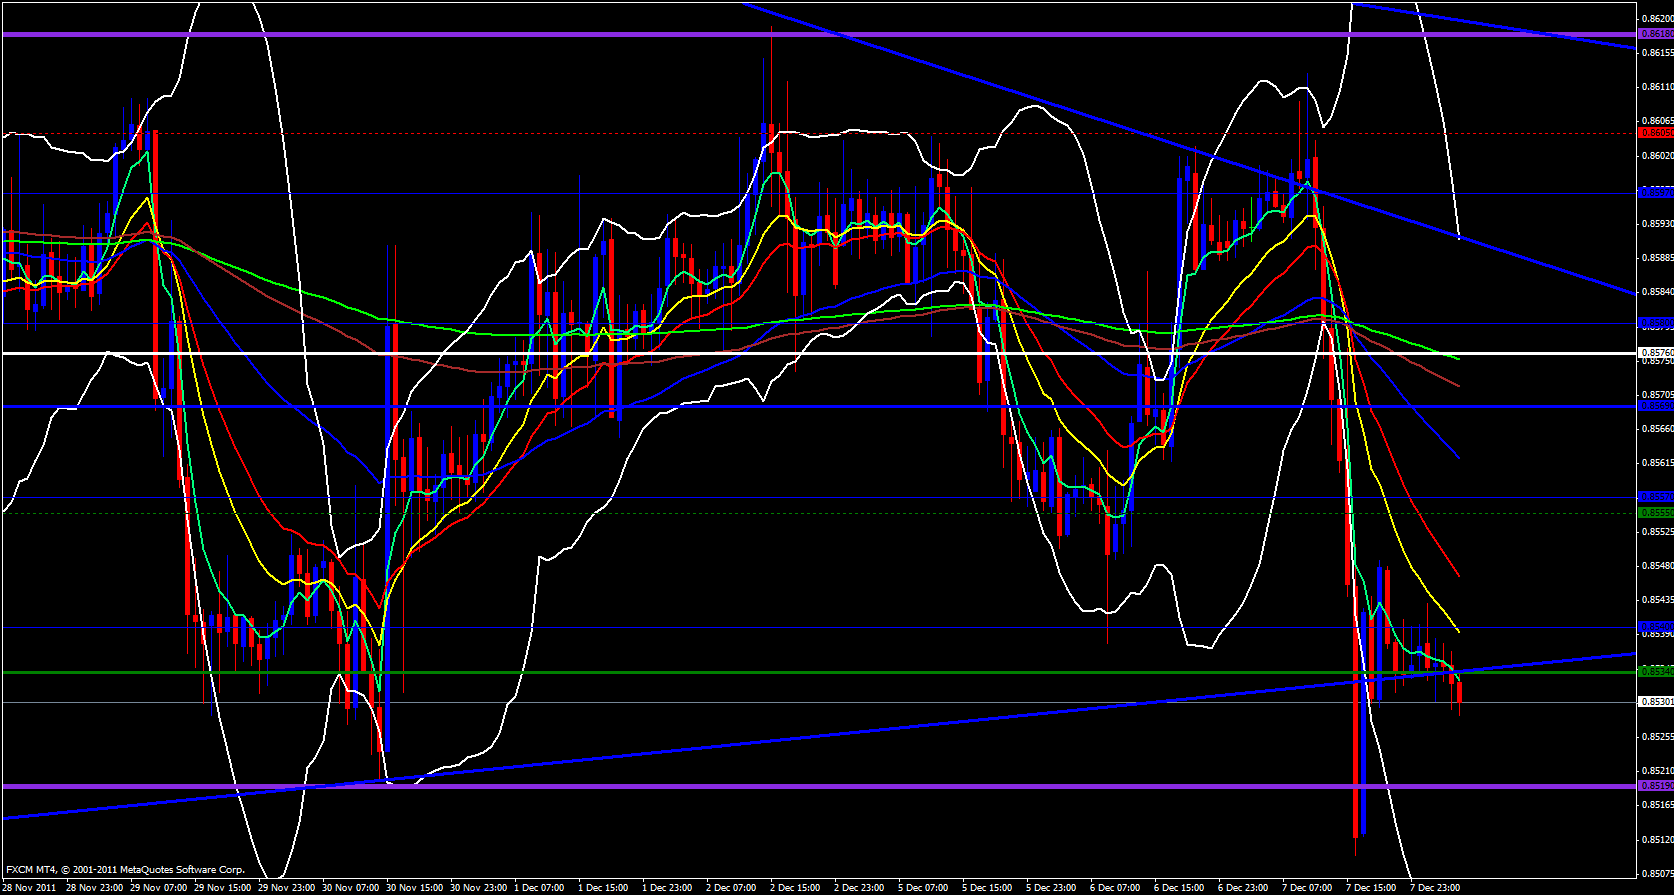
On the hourly chart price does look bearish however and has been riding along the 5 ema but last week's low is at .8519 which should cause a bullish reaction when price reaches it if it does reach it. To further add to the support the daily M2 is at .8522 and yesterdays low is .8510 and currently at the time I am writing this price is at .8530 so I expect to see bullish action for this pair today.


