By: Doug Rosen
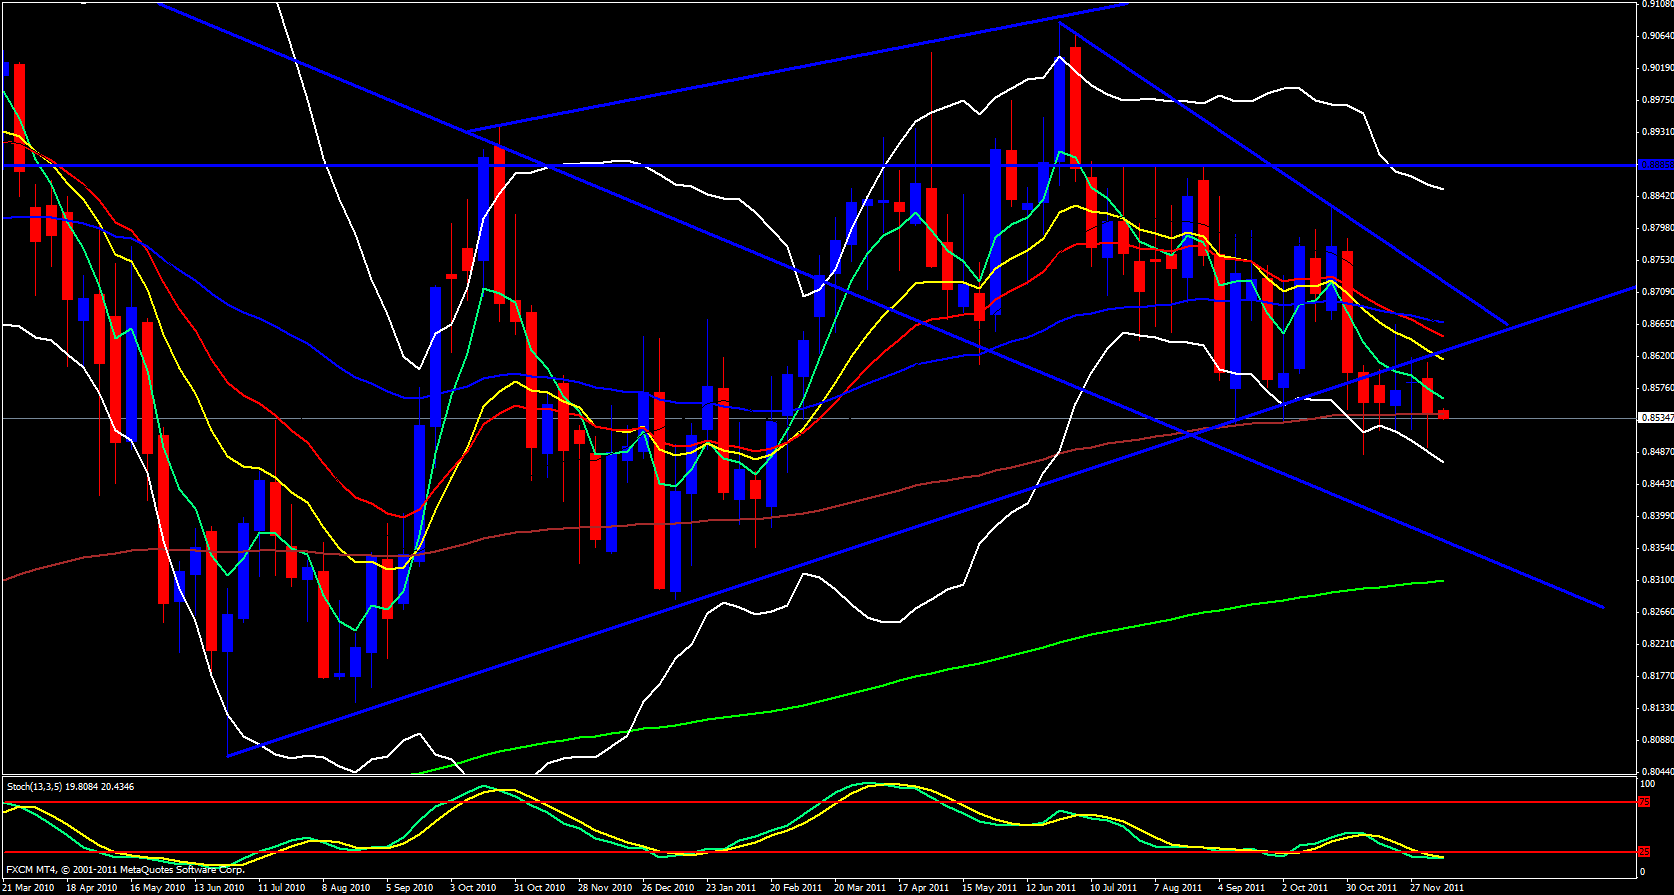
The new weekly candle for the EUR/GBP starts out just on the 144 ema and a bit below the 5 ema which means the 5 ema may soon be crossing below the 144 ema which could force price down below the 144 ema which has been support, then based on role reversal the 144 ema could then be resistance forcing price downward. Keep in mind that price could still go up a bit, even as high as the 13 ema before heading back down and on a weekly time frame this could still be a hundred or more pips up before it falls.
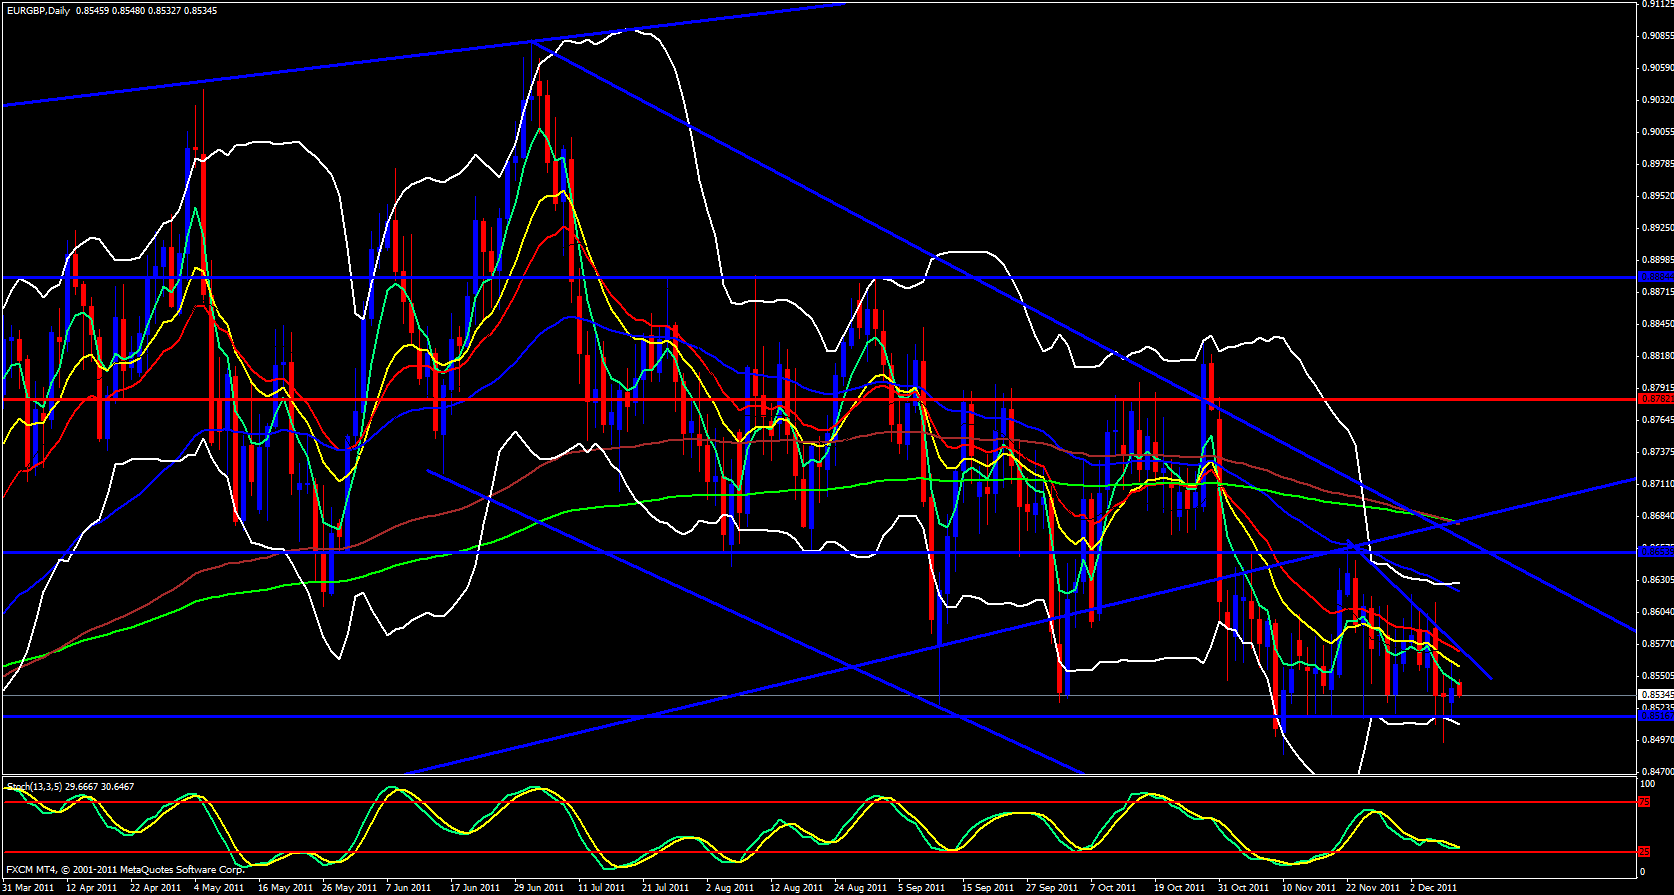
On the daily time frame price opened up just below the 5 ema but touching it and falling. Price can still spike up to the daily 13 ema before heading down as well. .8517 still stands a s strong support since price has not closed below it in a long time. For some reason that price level attracts bullish price action.
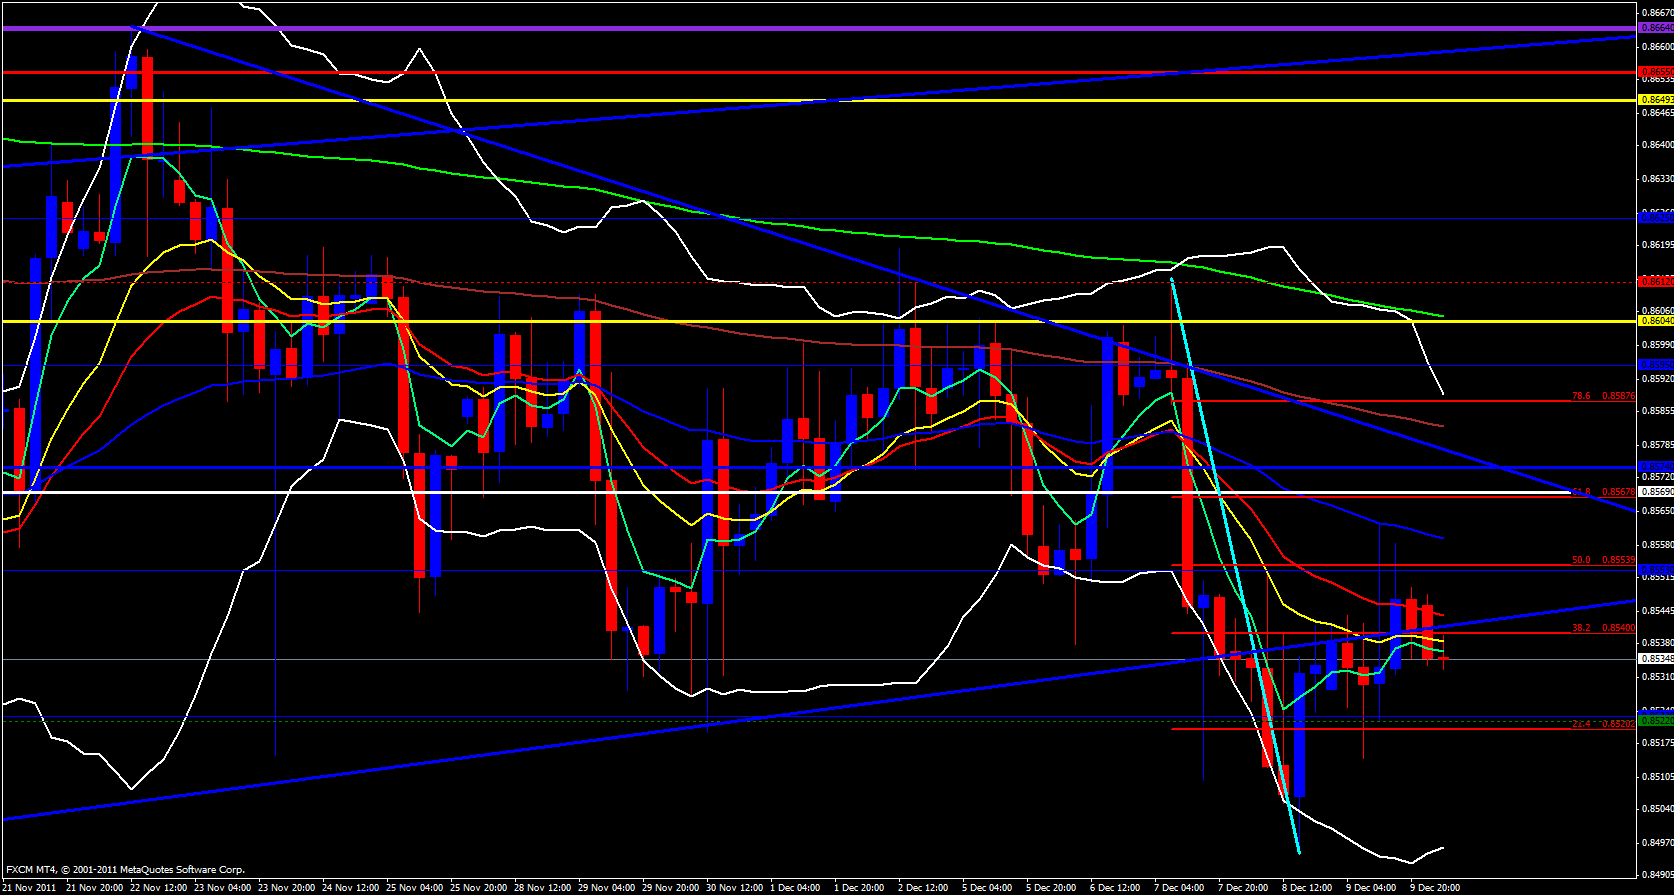
On the 4 hour time frame price has fallen from the zone between the 50.0 - 61.8 levels which was overlapped with a 55 ema and price tanked off the touch of the 55 ema. Now it seems however that the EUR/GBP is swinging its way upward, possibly up to the 4 hour 21 ema or even a trip back up to the 55 ema before continuing down.
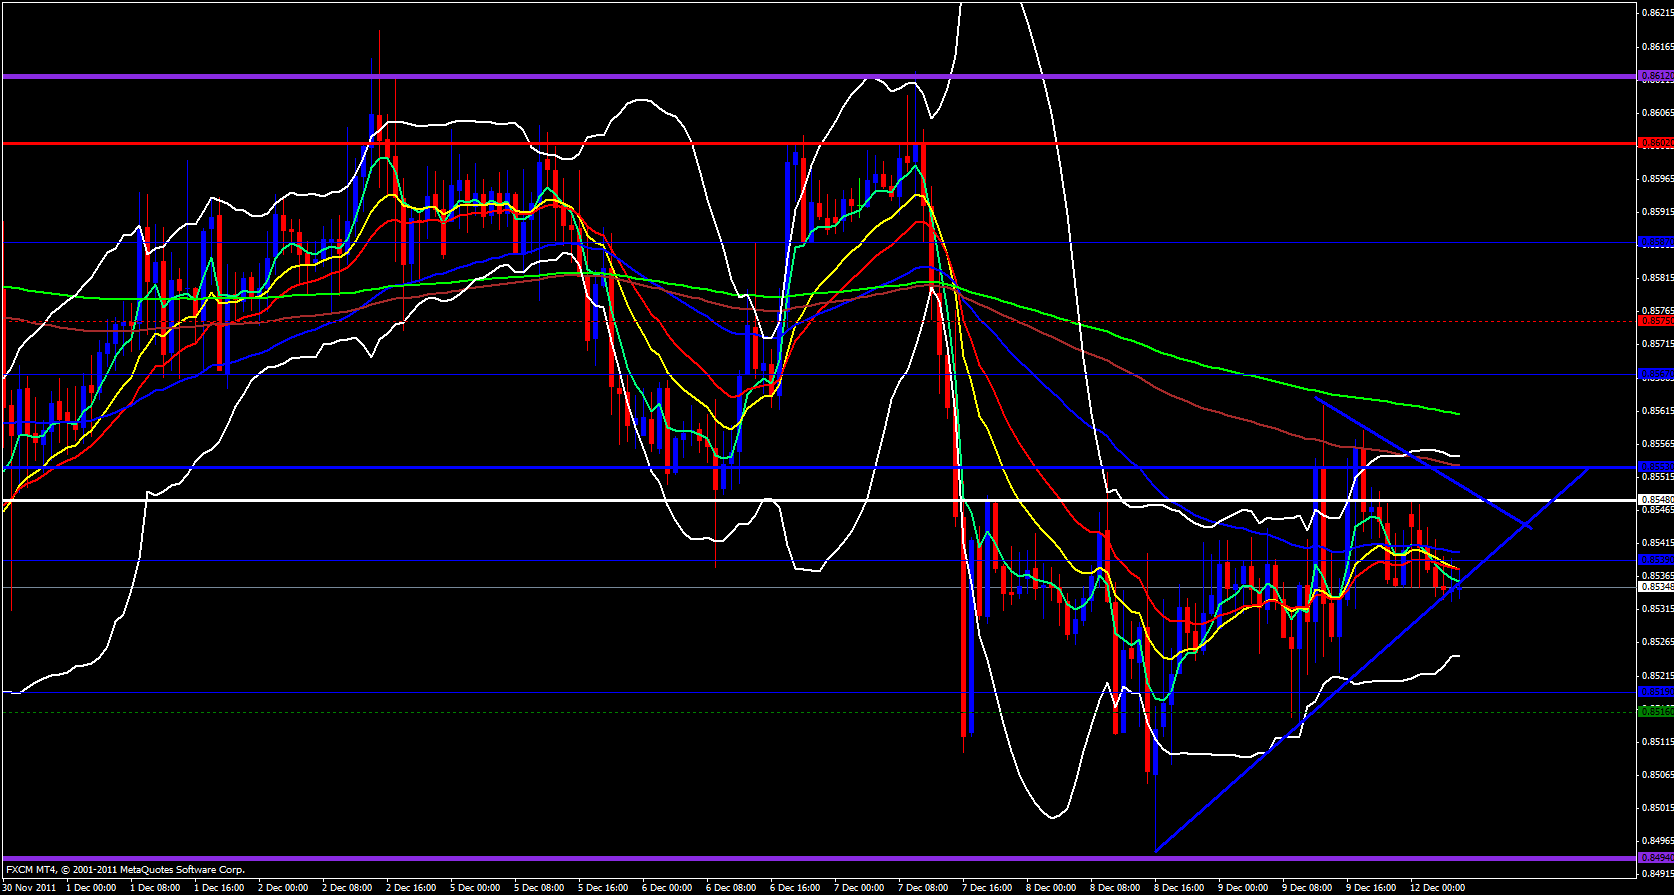
On the hourly time frame price is right on support but just below the 5 ema which has already crossed below the 13 and 21 ema's close to the nose of a triangle pattern which looks like it wants to push price down out the bottom of the triangle.
On the 15 minute time frame price is below the ema's and swing fibbing its way down. On the 15 minute price is in a triangle price trap of its own and at the bottom nose section of the trap if price breaks out it will keep dropping as low as .8525 before bouncing back up.


