By: Doug Rosen
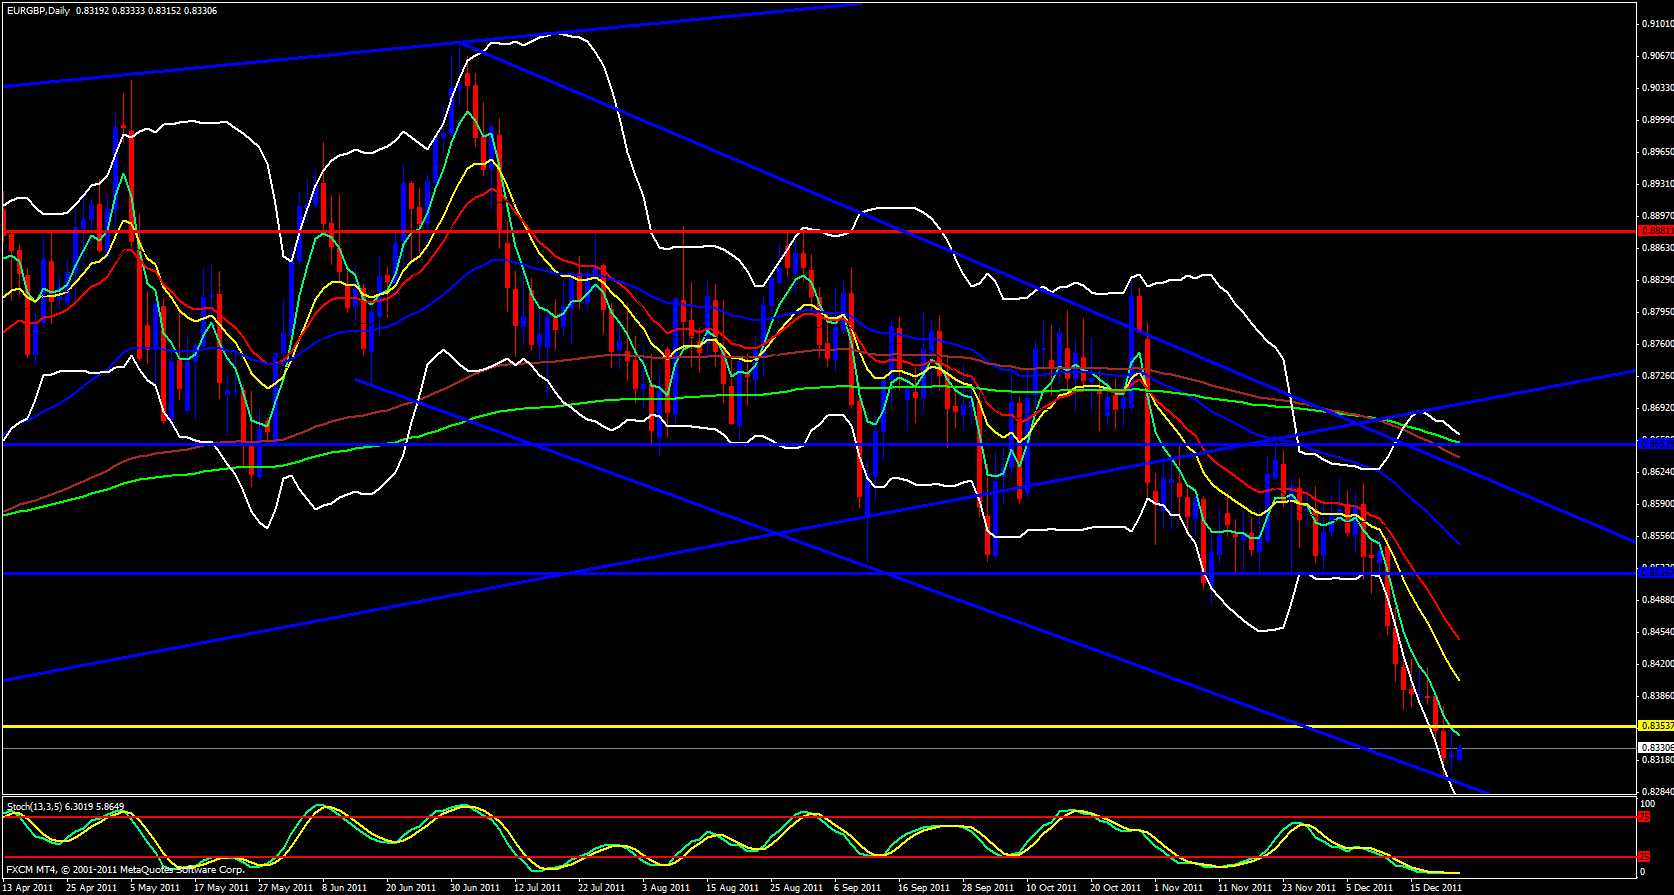
Yesterday the EUR/GBP produced a Doji at an area of support, the weekly 233 ema after a downtrend that has been lasting a couple weeks. I am sure you all already know that a Doji is a reversal candle. Doji's are quite common looking, they are simply a candle that opens and closes at the same area regardless of the range, however, it is not a true Doji unless it develops in an area where a reversal could potentially occur such as a strong area of support or resistance like the 233 ema.
This was the case yesterday with this pair on the daily time frame since the range was 41 pips though the open and close were only 4 pips of each other and it took place after the weekly candle touched the 233 ema. Once again this is an occurrence I pointed out in advance that fulfilled itself, that a retracement would begin. Yesterday was the first time since August that the weekly candle touched the 233 ema so I don't expect it to break straight through so easily and since the weekly and daily stochastics is in the oversold zone and the weekly candle is outside the lower Bollinger band and gapped a distance from the 5 ema a retracement to the upside is realistic before price continues back down and just may break through the 233 ema next time around.
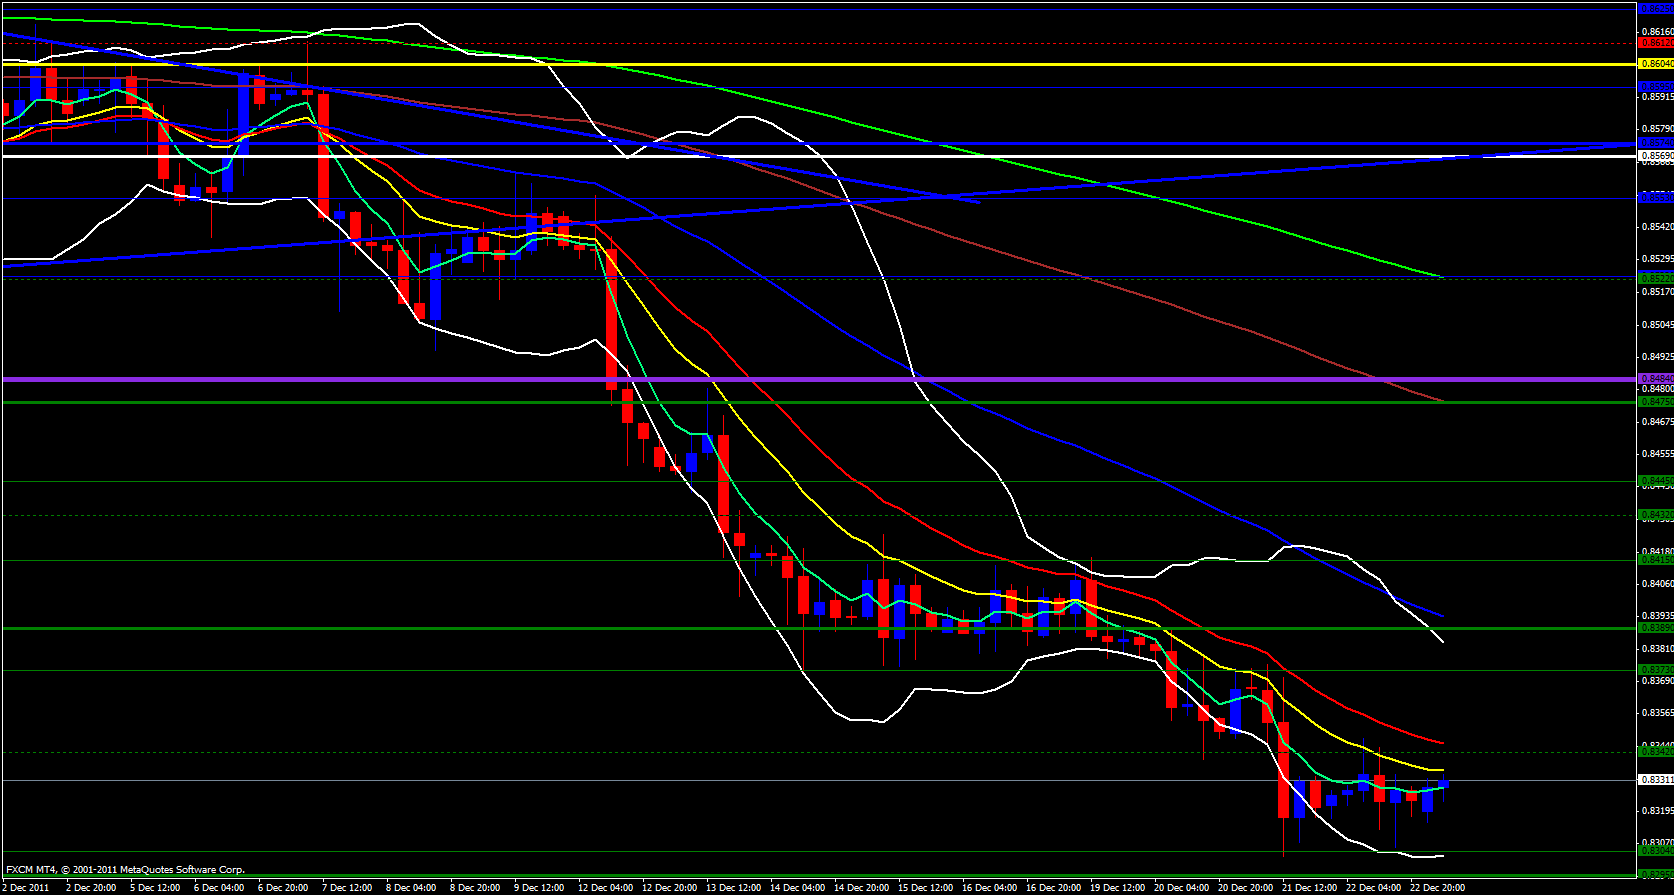
On the 4 hour time frame price has made a couple sets of higher lows and the 5 ema is just underneath price yet the 13 ema is just above price not to mention the mighty 21 ema not too much further above the 13 overlapped with the M0 at .8342 which is now resistance so the retracement will not be easy especially since this is the last day of the trading week and much of the major players are already on vacation slurping up their margaritas.
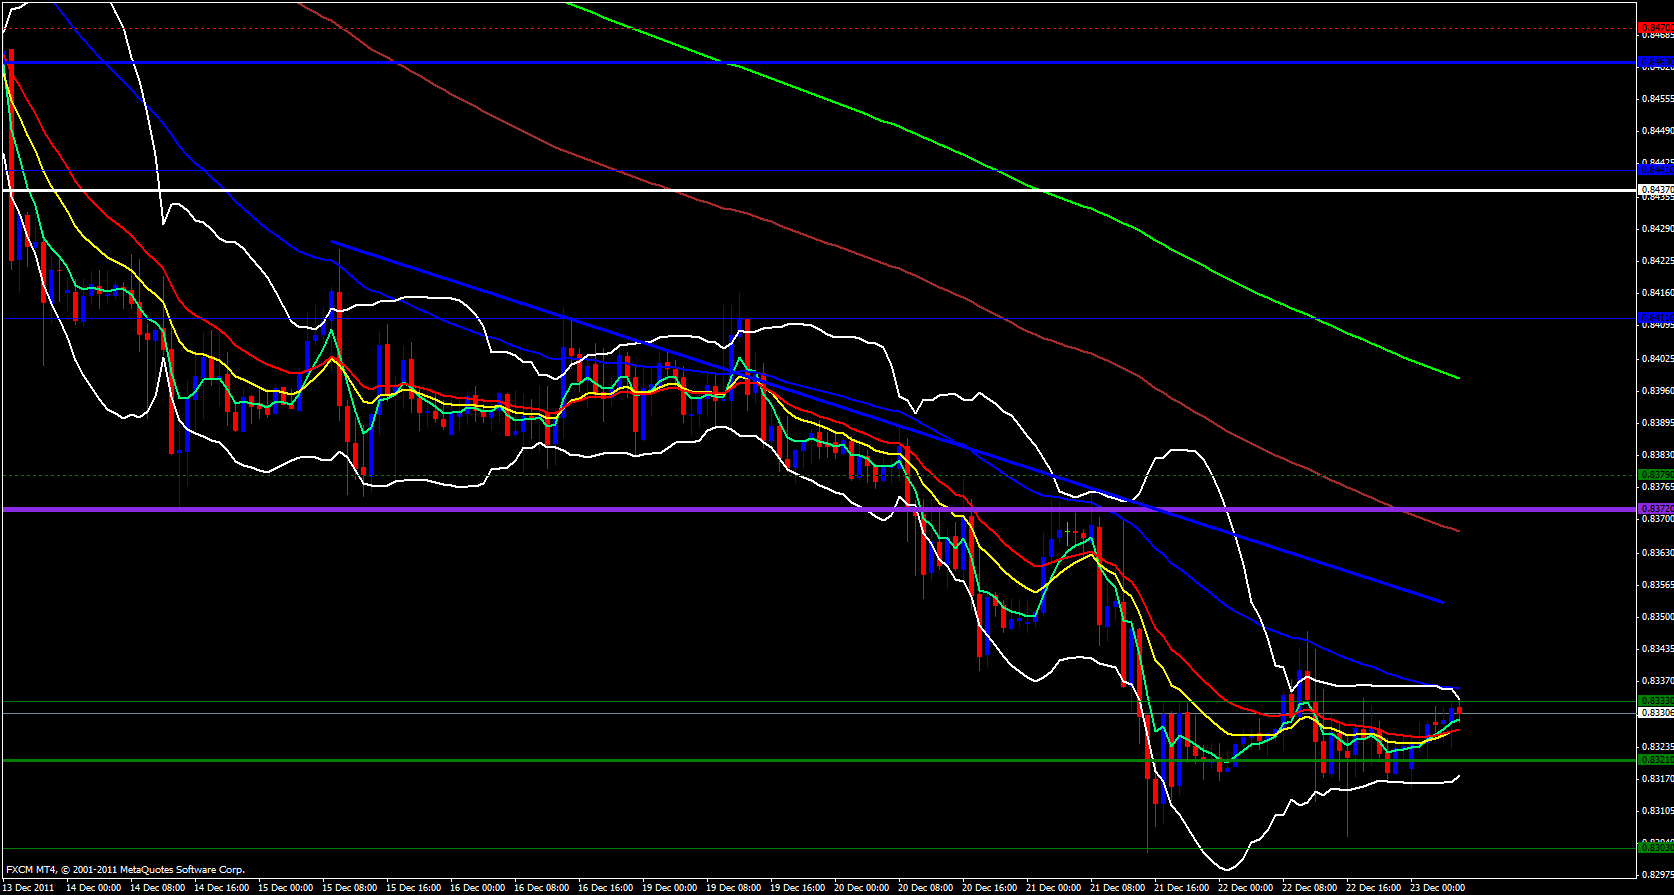
On the hourly time frame the Bollinger bands are narrow and pointed shut and the 55 ema is just above currently price action.
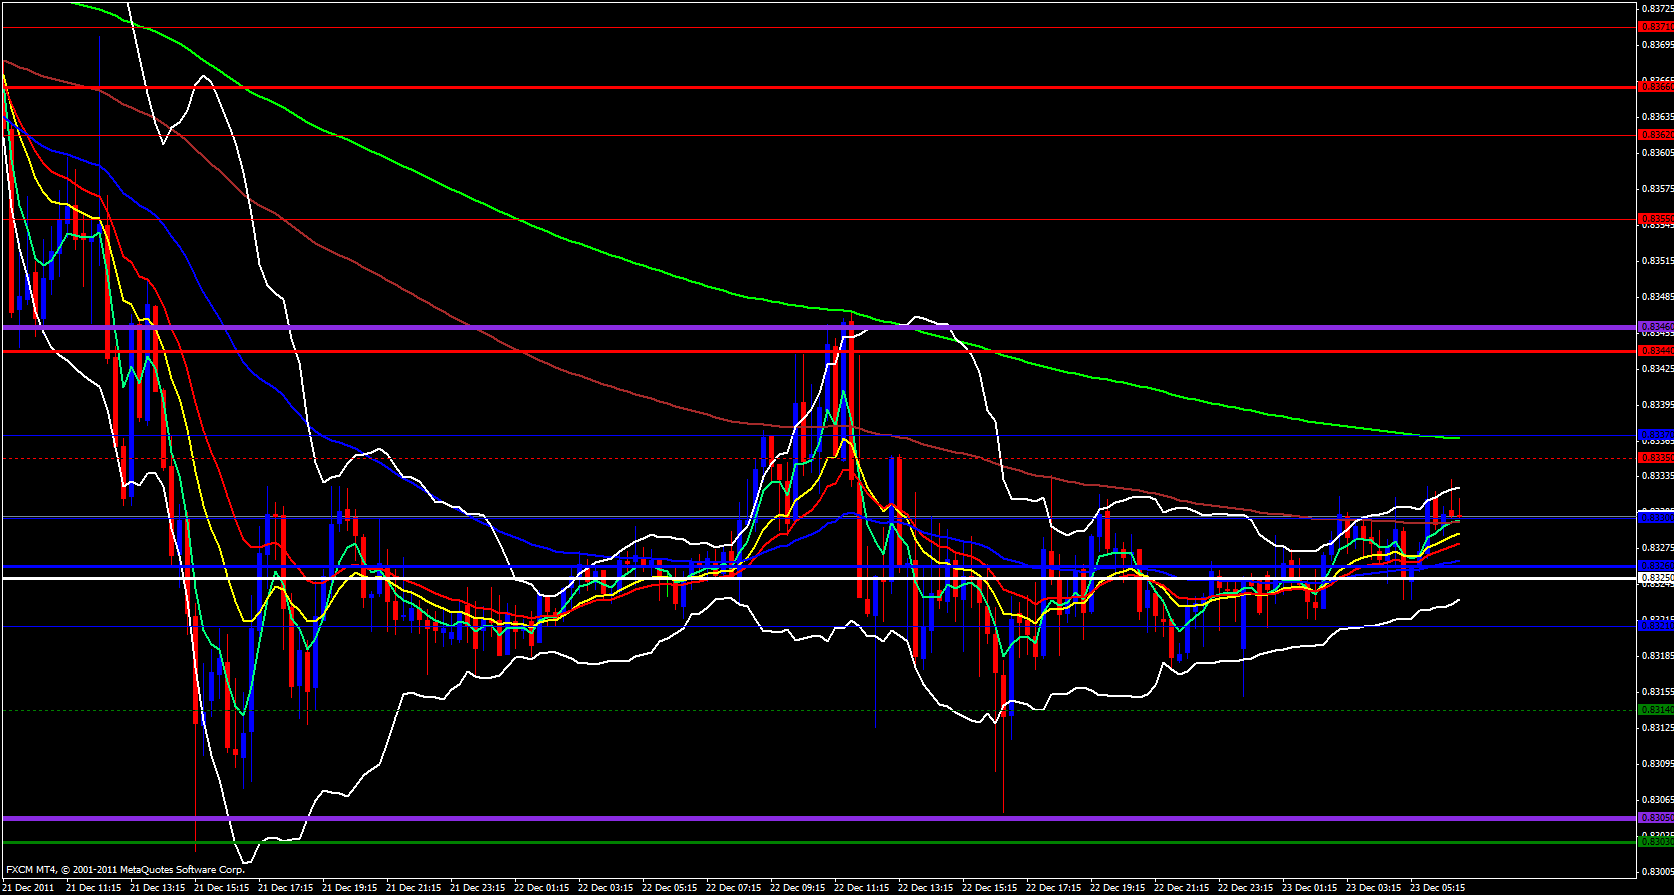
On the 15 minute time frame price has made a double bottom around .8305 and has already made a few sets of higher lows. The 233 ema is also not too far above and adding to all the other layers of resistance I have pointed out and overlapped with the daily M3 pivot at .8335 So, to get into a decent bull position today wait for price to break and retest the 233 ema then take your long.
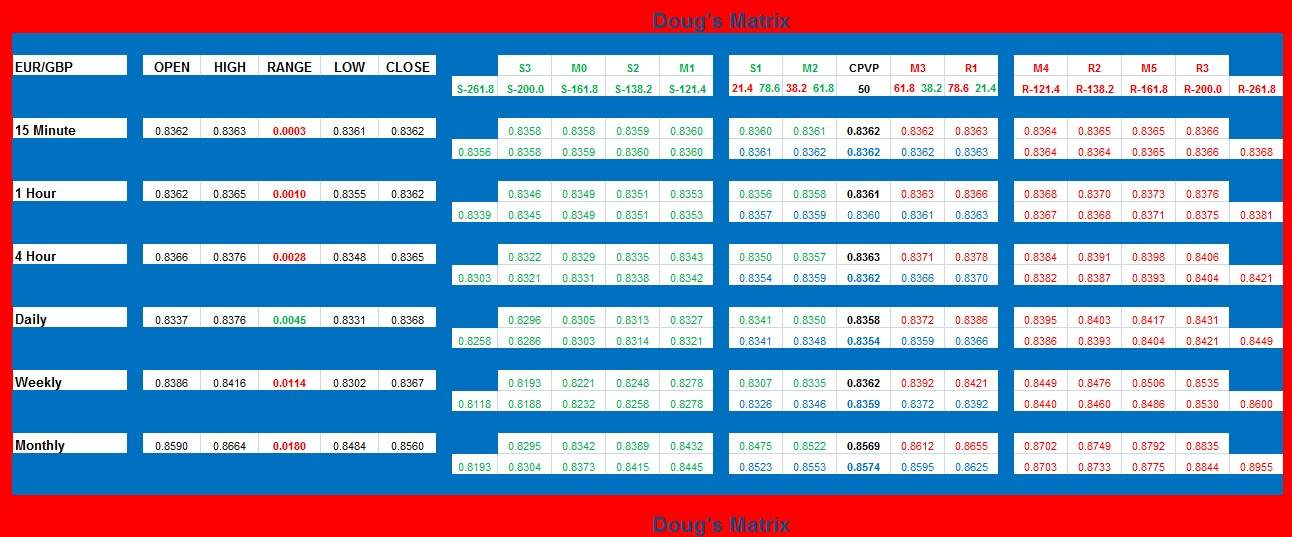
Included in my analysis is my custom made Support & Resistance Matrix which points out the various levels of support and resistance over multiple time frames mathematically based on Pivot Point and Fibonacci theory so keep an eye on those price levels prior to entering any positions. It may save you from entering longs at resistance or entering shorts at support.

