By: Doug Rosen
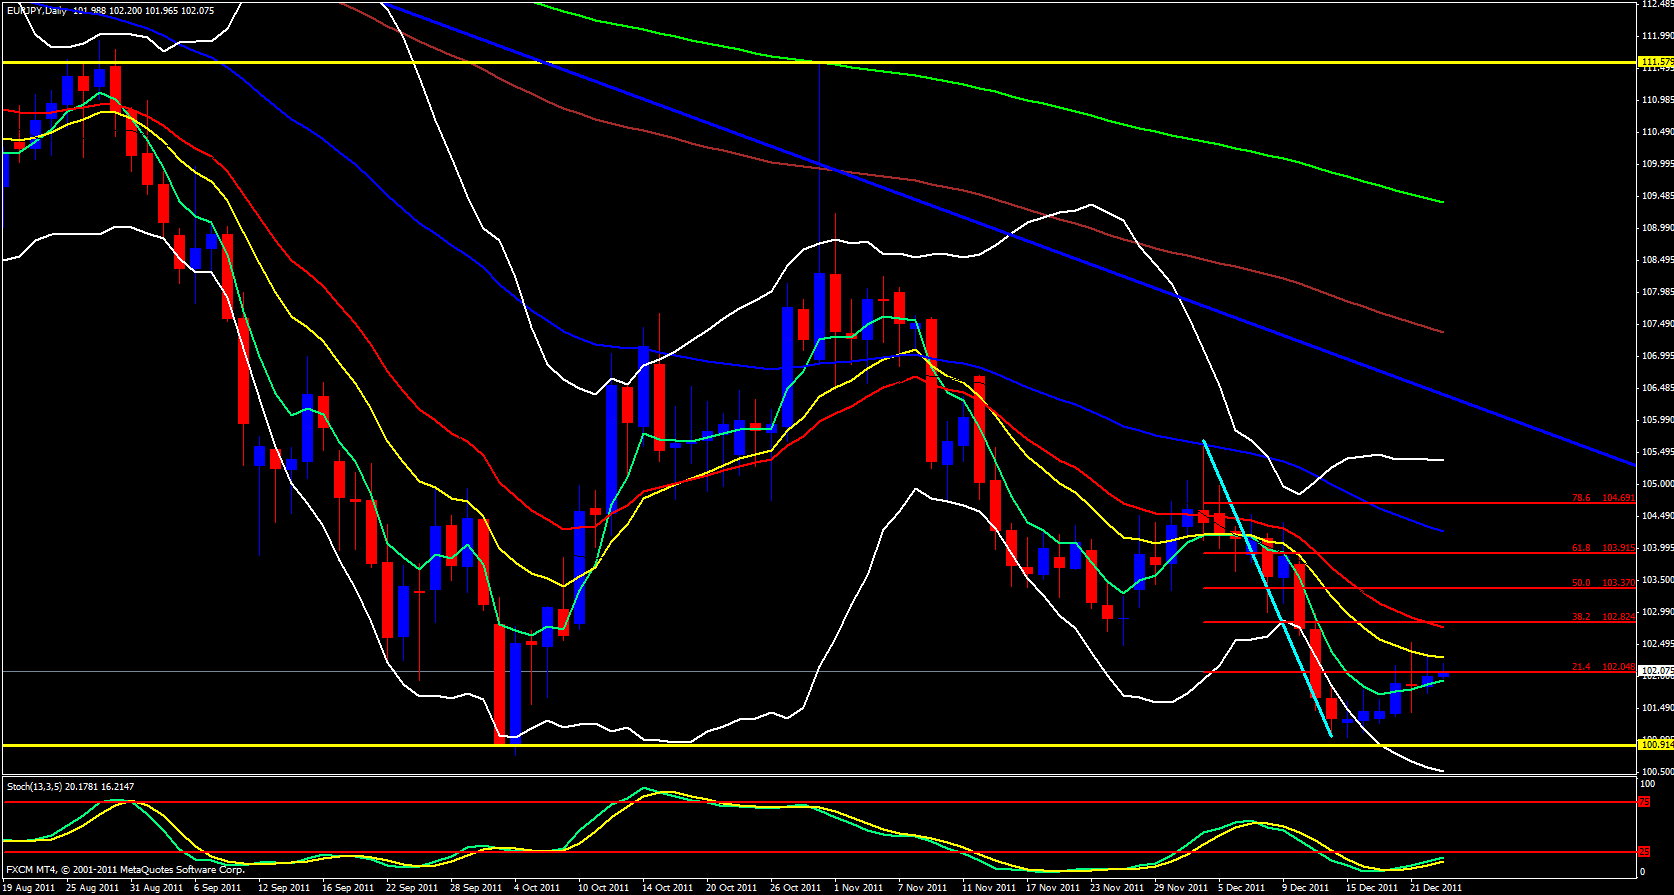
Yesterday was a slow day for the EUR/JPY. Its range was only half of what it normally is. On the daily timeframe it is obvious price is heading up to make the retracement that is overdue, however, the last few days we have been making higher lows but at the same time we also been making lower highs which is just another way of saying we are in consolidation. As for today, price seems to be heading up at this moment, however, it is approaching the 13 ema which I expect will add resistance to the retracement as it should, but it won't stop it, just fight it a bit. Price is above the 5 ema. This pair should head up to the 38.2 fib which is overlapped with the mighty 21 ema at around 102.82 and it would make a lot of sense for price to drop at that level.
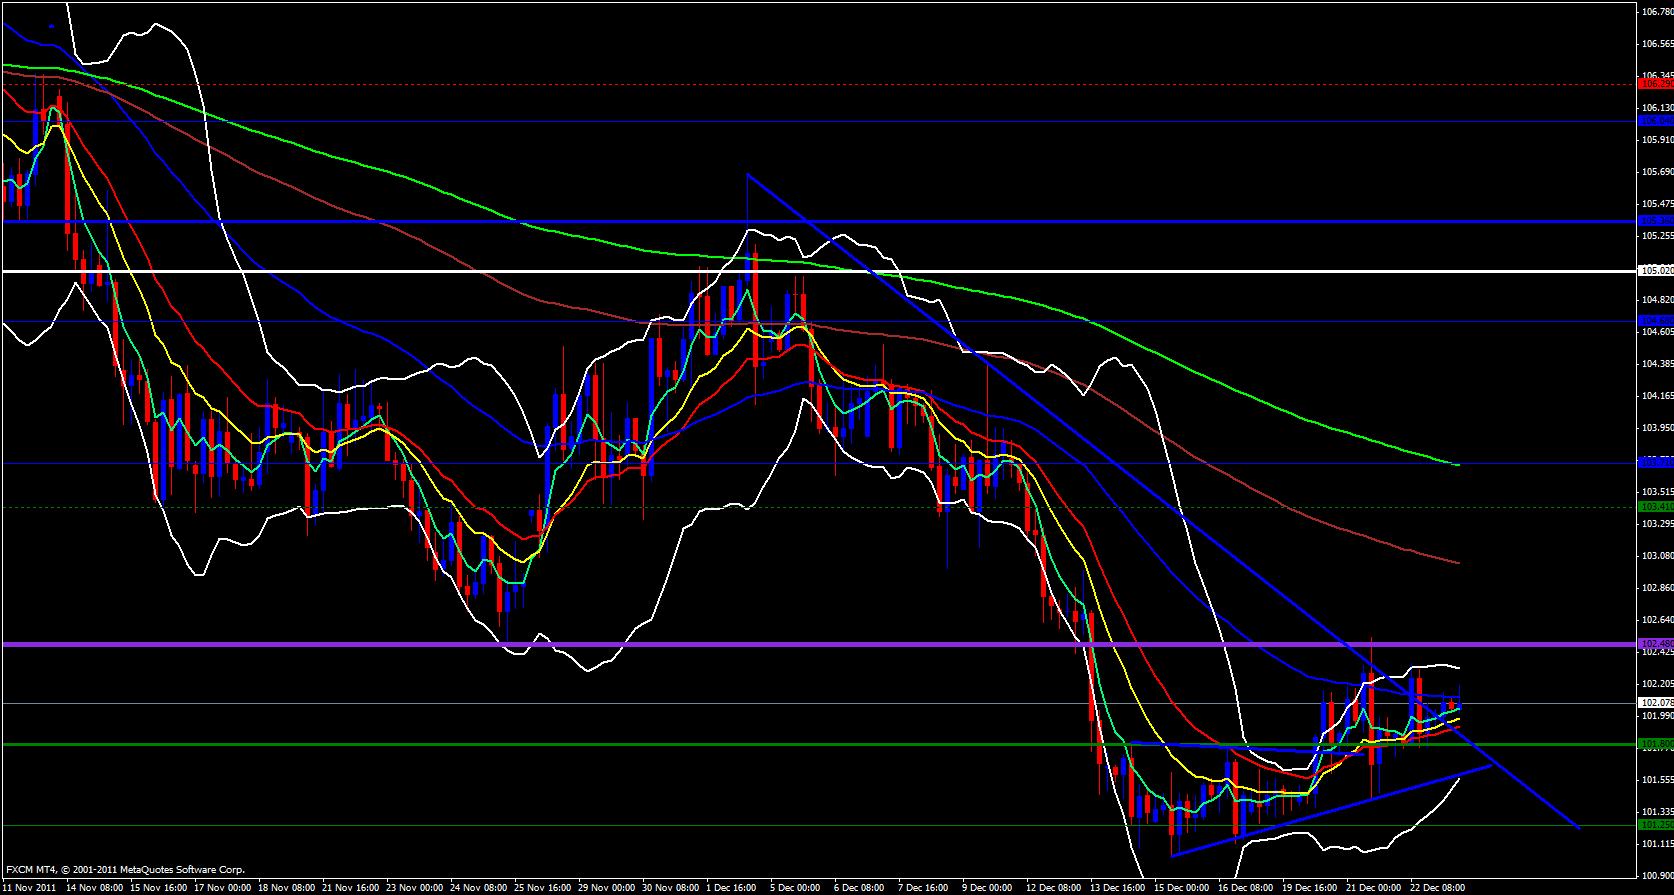
On the 4 hour timeframe price has broken above the upper trend line and has pierced the 55 ema and price is riding up the 5 ema. Problem is the upper Bollinger band has not opened yet and this pair will not go anywhere if the upper Bollinger band does not open.
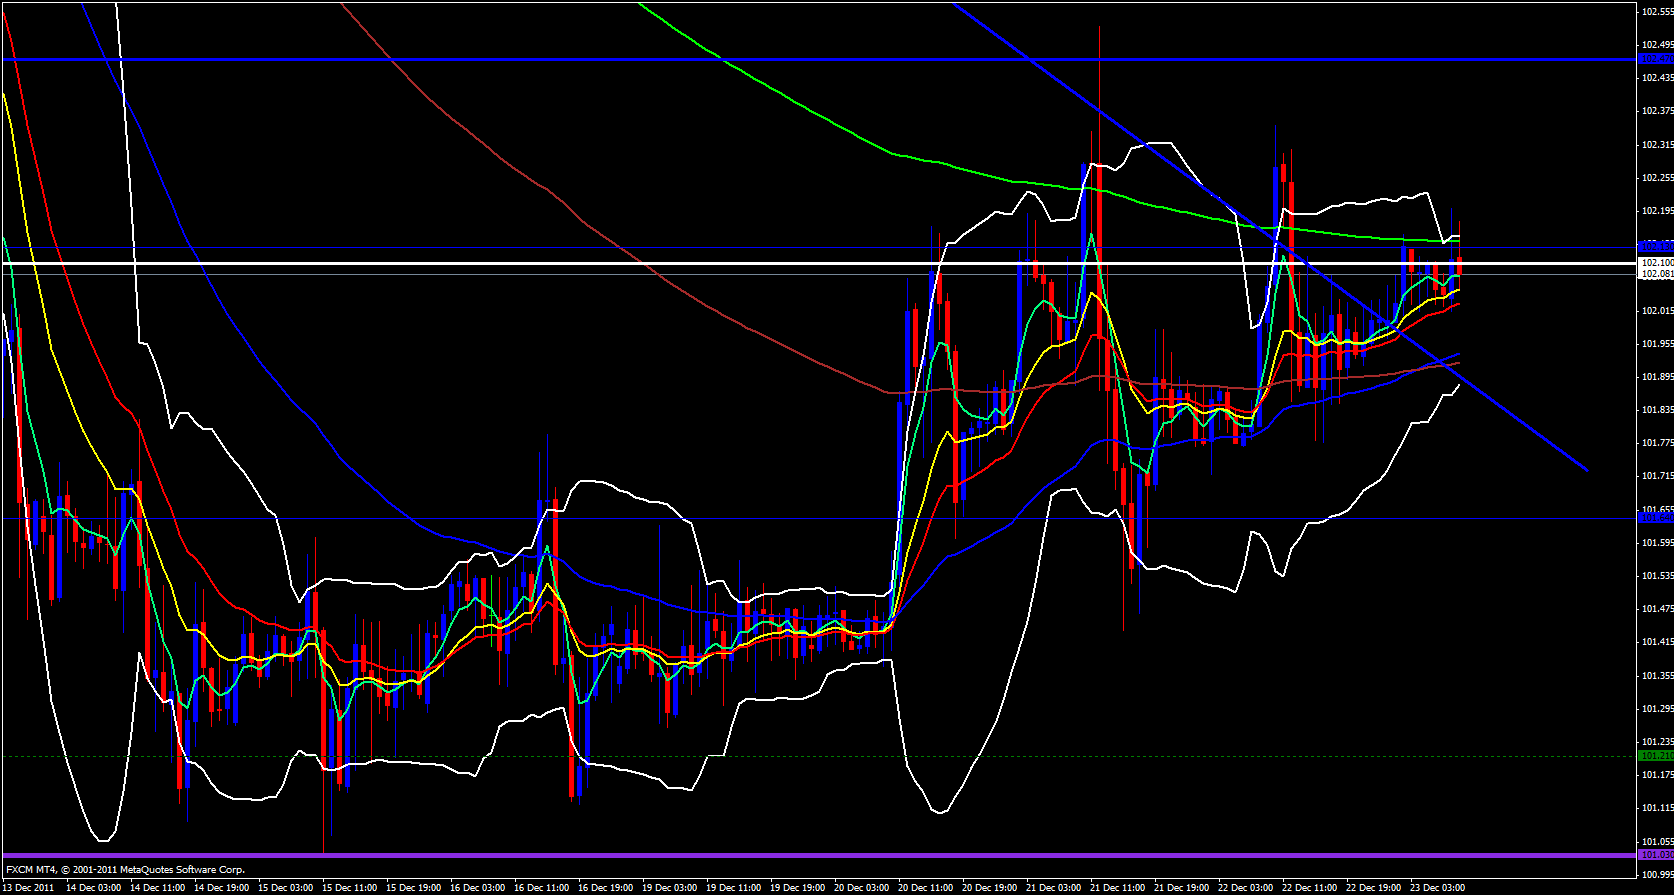
On the hourly timeframe price is approaching 102.18 which has been a very strong area of resistance. Price is trying to break it and if it does price should keep heading up until it reaches the fib level I mentioned earlier. Price is however, above the weekly central pivot and above the 5 ema but below the 233 ema which is deterring price from breaking resistance.
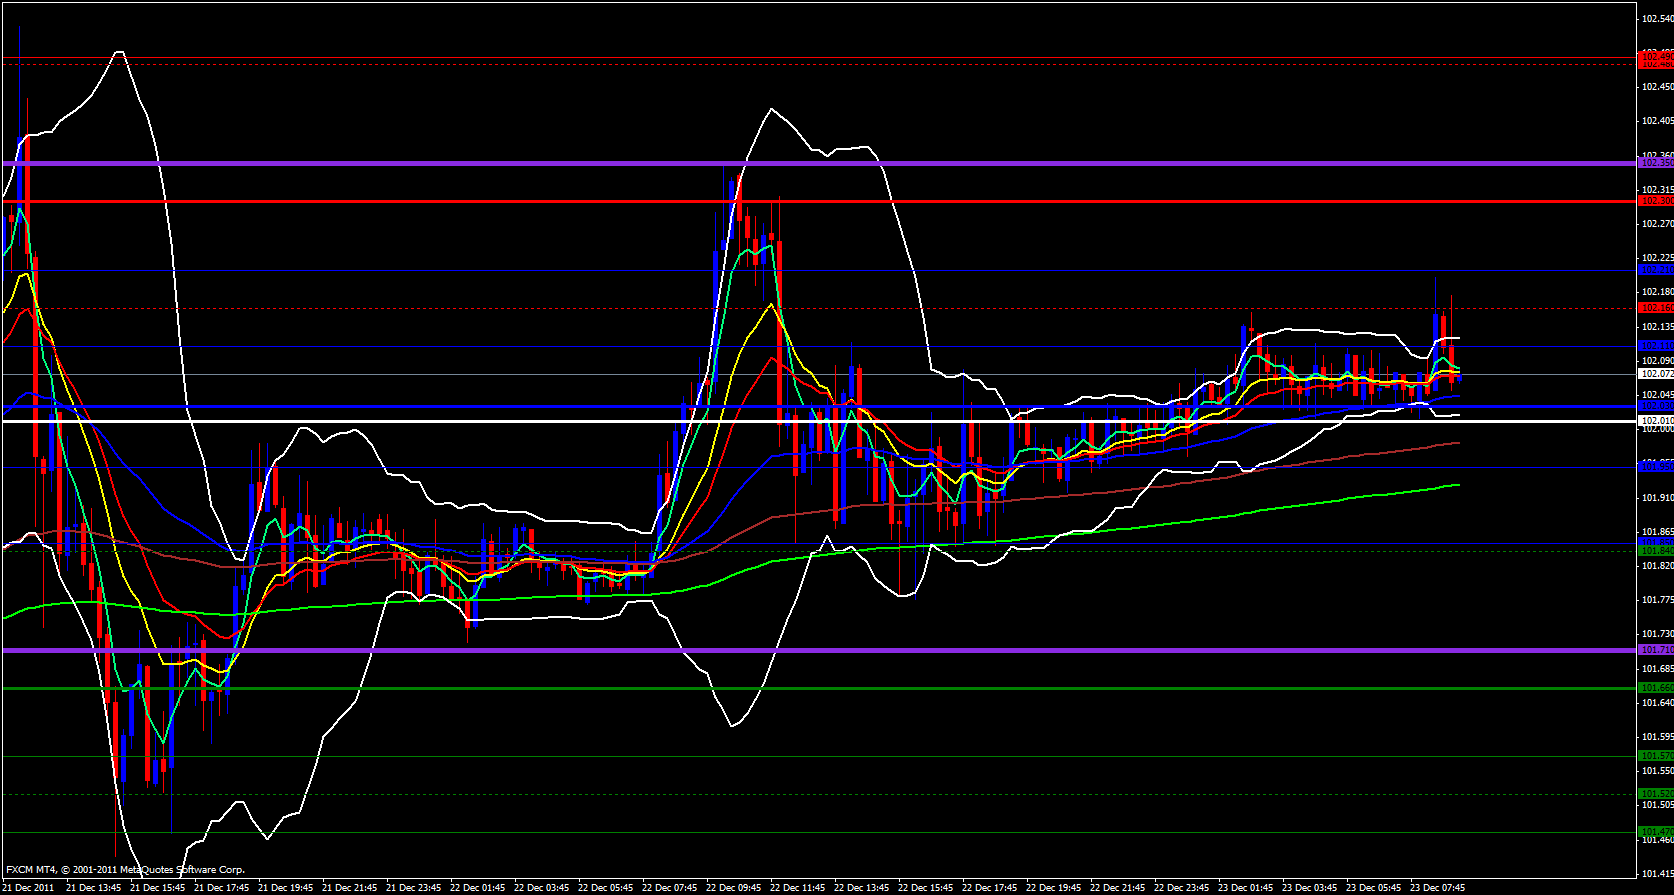
Finally, on the 15 minute timeframe price appears to be heading up, is above the 55 ema and above the daily central pivot. I continue to be bullish on this pair as long as it stays above the daily central pivot point at 102.01
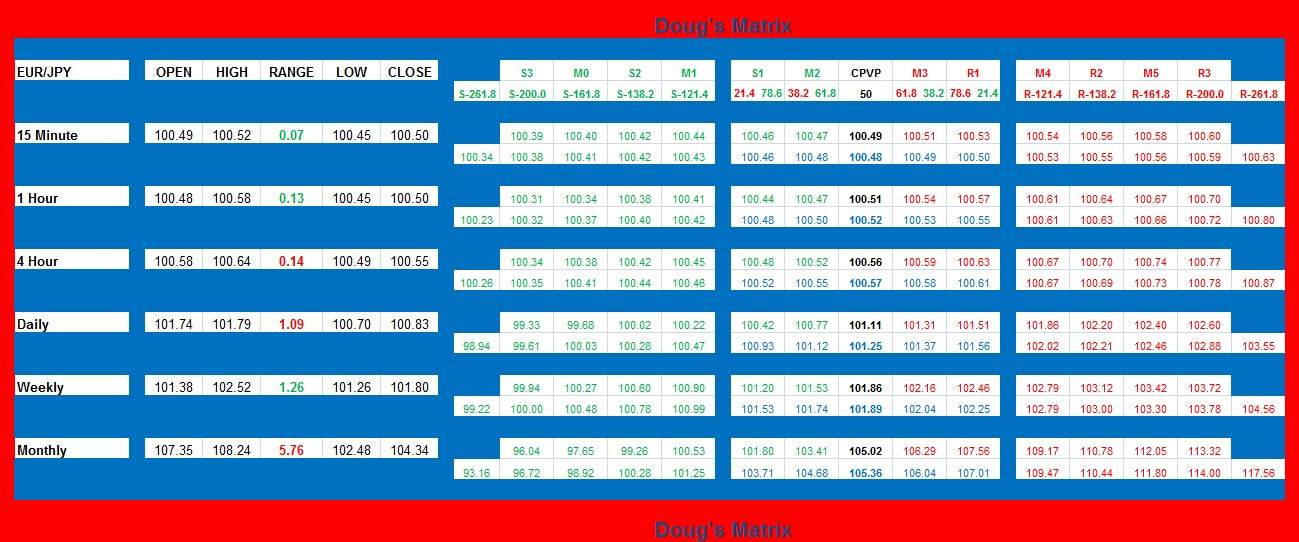
Included in my analysis is my custom made Support & Resistance Matrix which points out the various levels of support and resistance over multiple timeframes mathematically based on Pivot Point and Fibonacci theory so keep an eye on those price levels prior to entering any positions. It may save you from entering longs at resistance or entering shorts at support.


