By: Doug Rosen
The EUR/JPY sure was a wild pair yesterday. The total daily range was 108 pips yet price opened and closed within 3 pips of each other. On the weekly time frame price rose to nearly the 5 ema and fell. At that same time on the daily time frame price rose to the 13 ema just a bit below the 38.2 fib.
On the 4 hour time frame price escaped from the trap it was in then fell back in within the trap and now it is back outside above the trap approaching my trend line. The 55 ema is not too far above current price action and it is overlapped with a trend line so I expect a fight around 102.20 area.
Price is currently just below the weekly central pivot which is shadowed by the hourly 233 ema just above at the same 102.20 area. If price breaks above it I expect it to go to 102.65 before it runs into a fight. If it breaks that zone then it will probably head to 103.15 area. If it can't make that break then it will probably drop down to 101.00
On the 15 minute time frame price is heading up and price is above the daily central pivot at 101.93 and the daily M3 is at 102.18 an area I mentioned earlier with thick resistance. A break above that level will surely help this pair rise today.
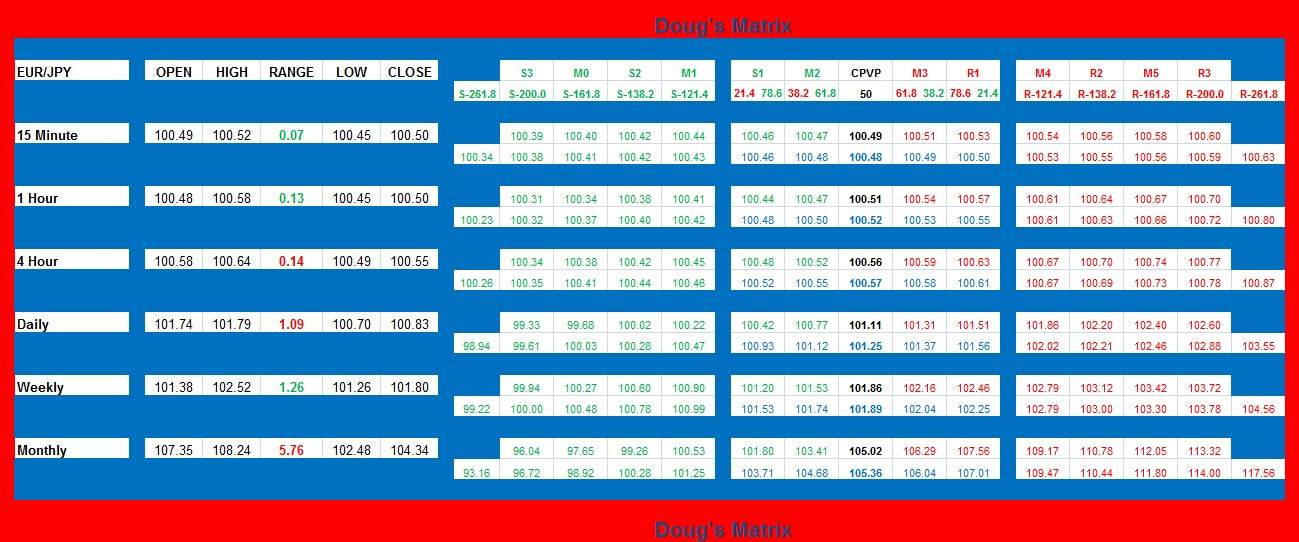
Included in my analysis from now on is my custom made Support and Resistance Matrix of my own personal design. It is complex but will provide you with all the possible support and resistance areas to watch out for. This is strictly a mathematical based system that calculates Pivot Points and Fibs over multiple timeframes.


