By: Doug Rosen
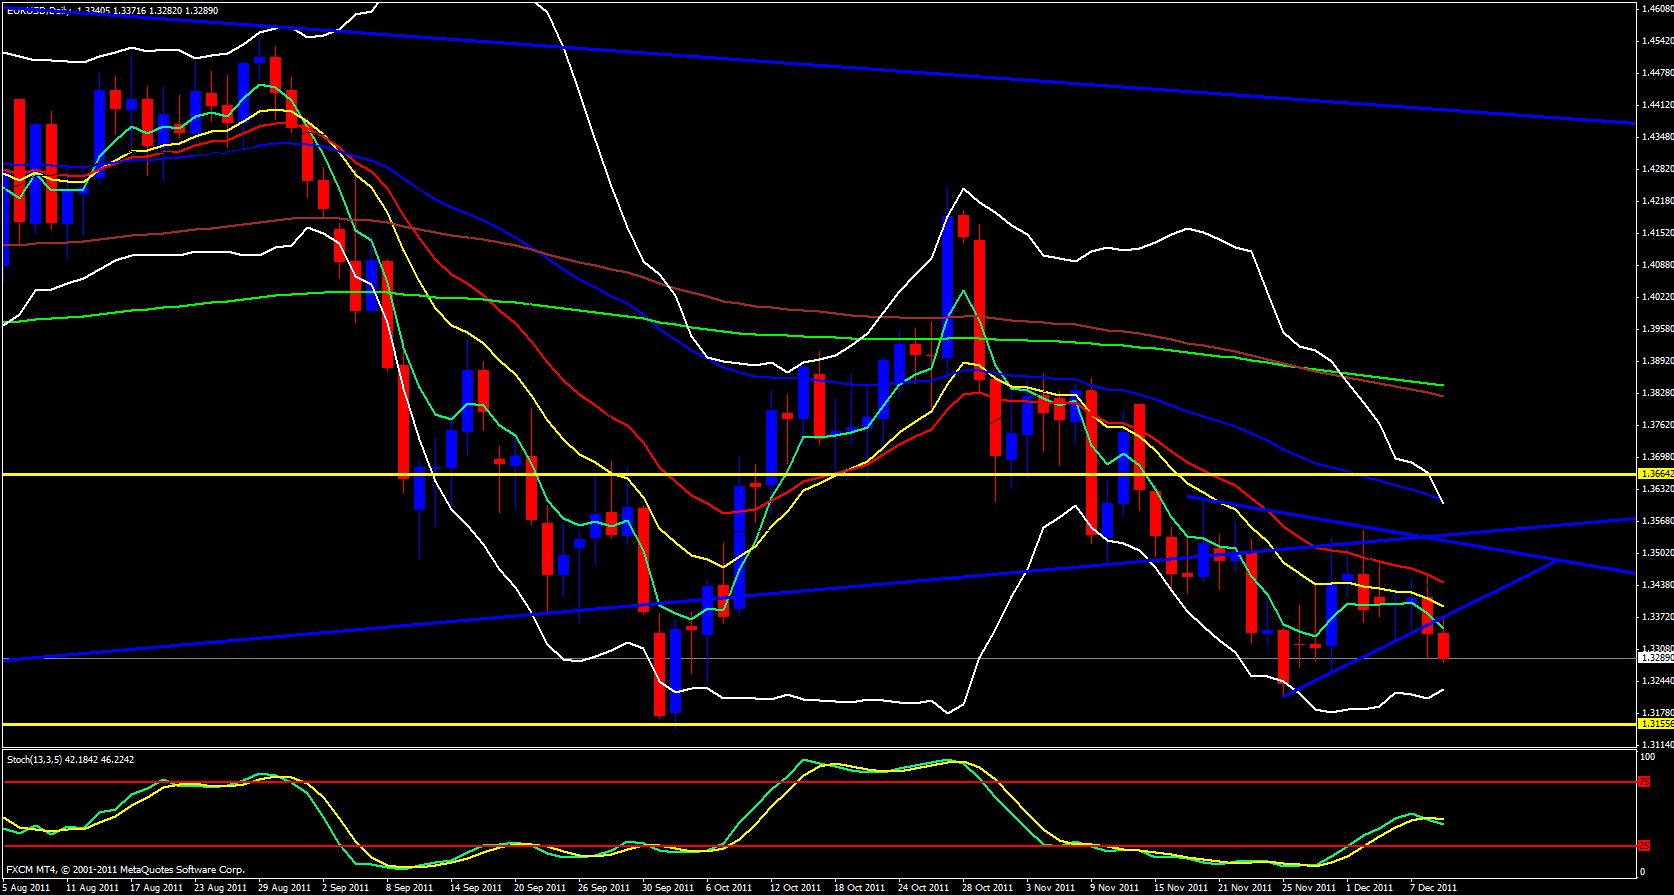
Today price opens up just below the daily 5 ema. Price touched the 5 then dropped. Price opened up outside of the triangle trap price had been previously trapped in.
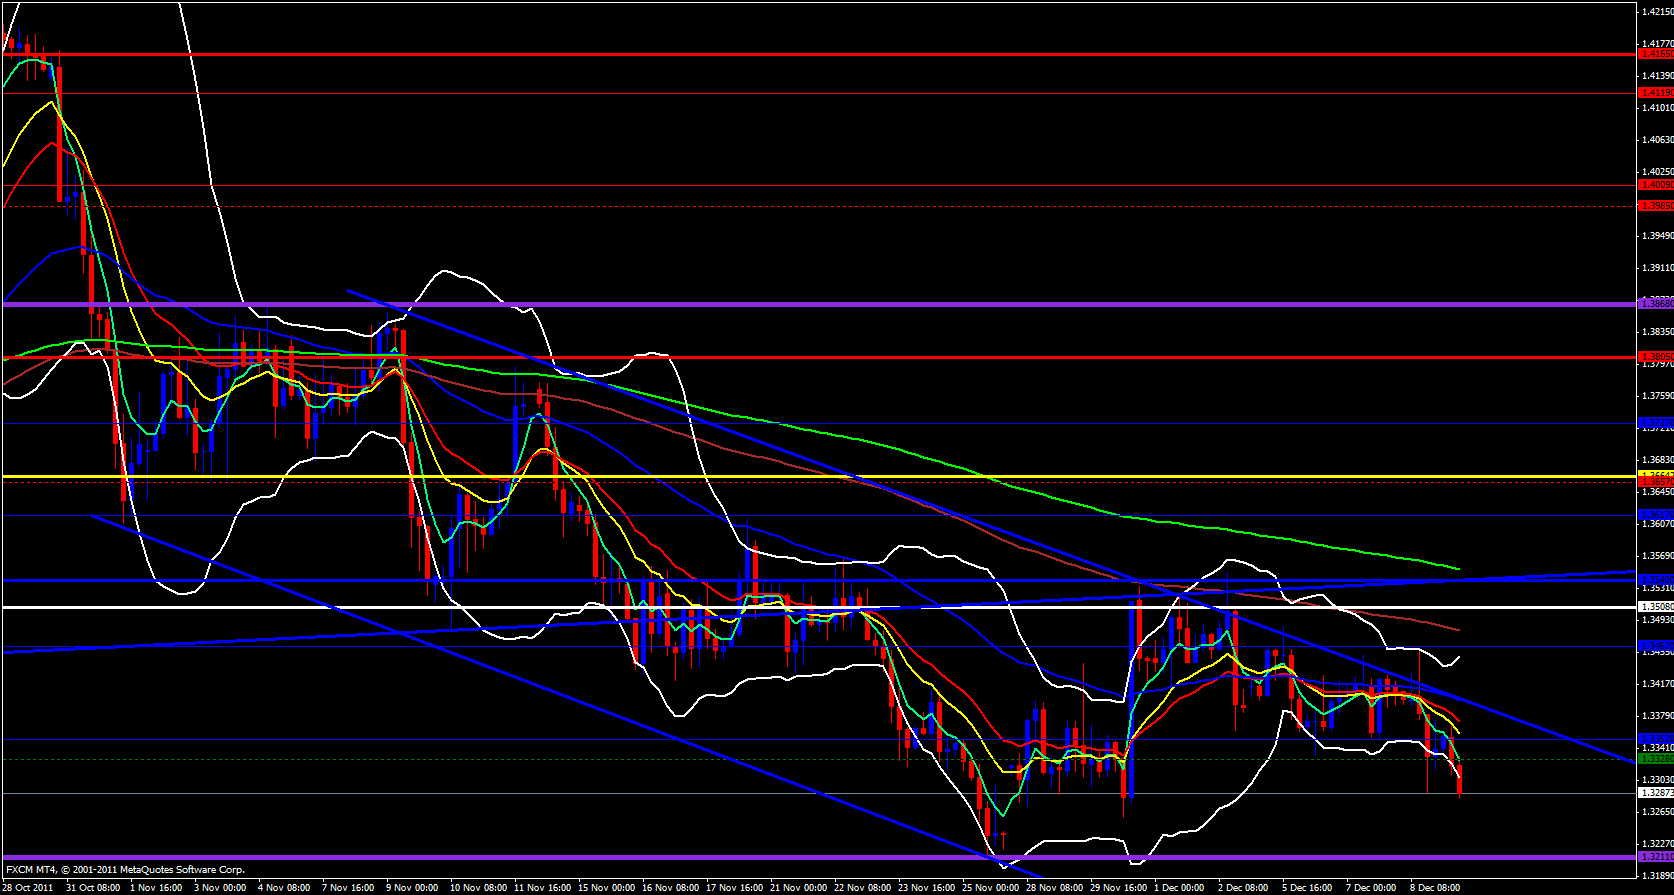
On the 4 hour time frame price is still within the price channel it has been in since October and heading down. Price is riding the 5 ema downward and the lower Bollinger band is open and pointing down. Price has just recently breached the monthly M2 at 1.3328 I expect this pair to continue to fall since the 5 ema has much angle and separation from the other ema's.
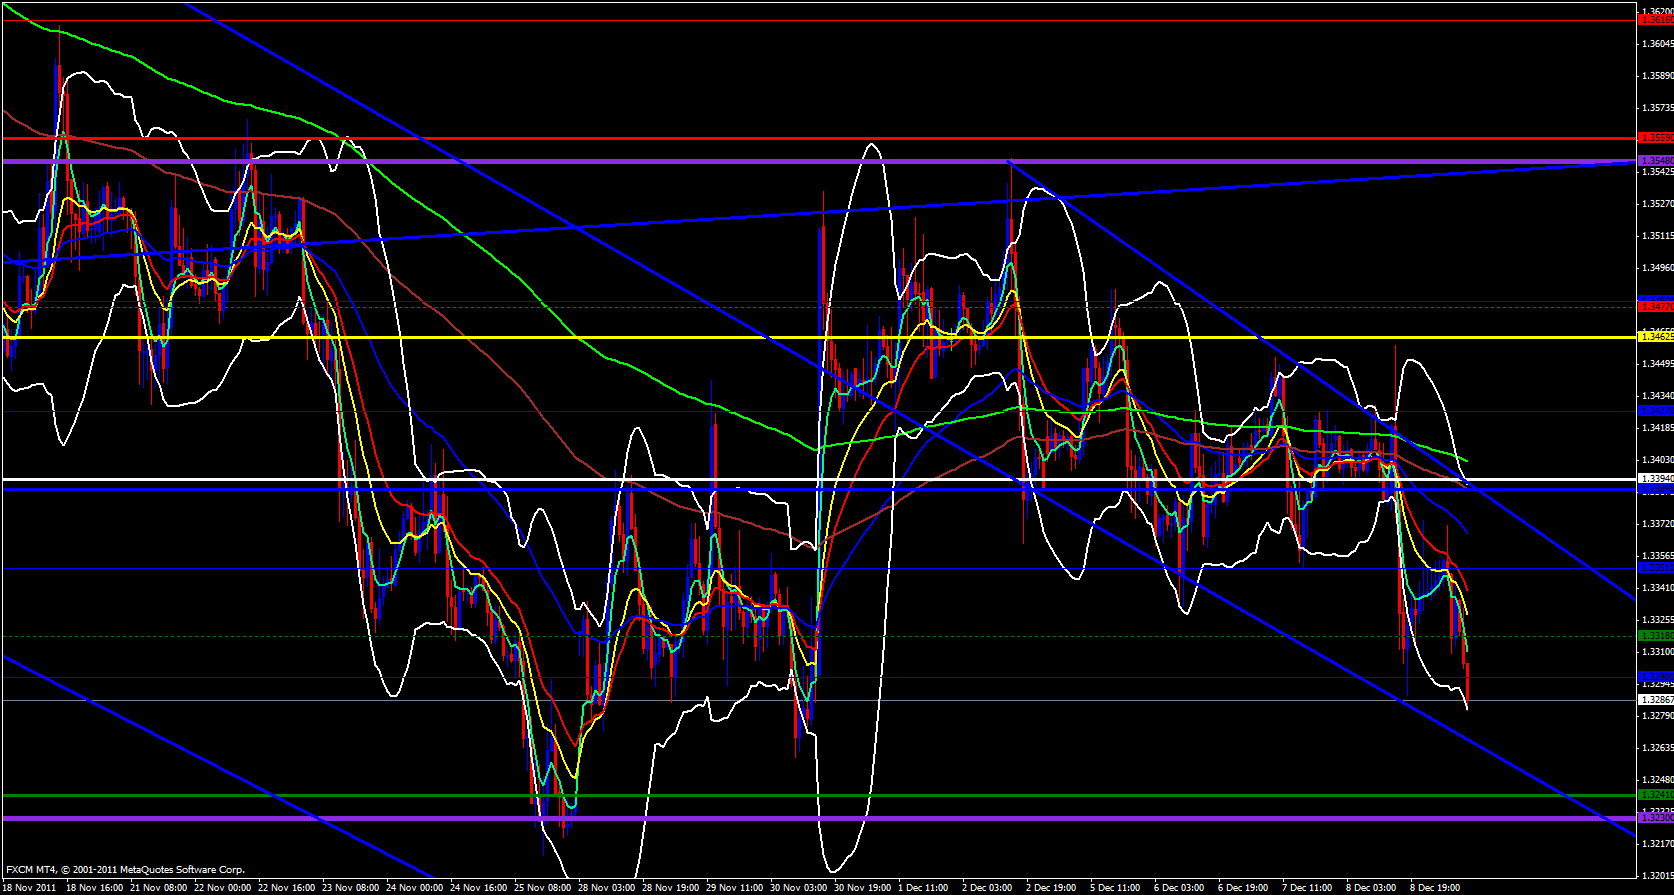
On the hourly time frame it is clear price made a 50.0 fib overlapped with the 55 ema and tanked. Price recently broke below the weekly M2 at 1.3318 and is dropping further down. Lower Bollinger band is wide open and pointing down and price is heading down towards the bottom of the hourly price channel. I am watching for price to break out of the price channel then to make a retest then look for shorts. The weekly S1 exists at 1.3241 which is just above last week's low at 1.3230 so when price reaches that level for sure profit taking will occur causing a bounce up offering traders opportunities to enter some scalp longs then to enter shorts from resistance such as a fib level or an ema.
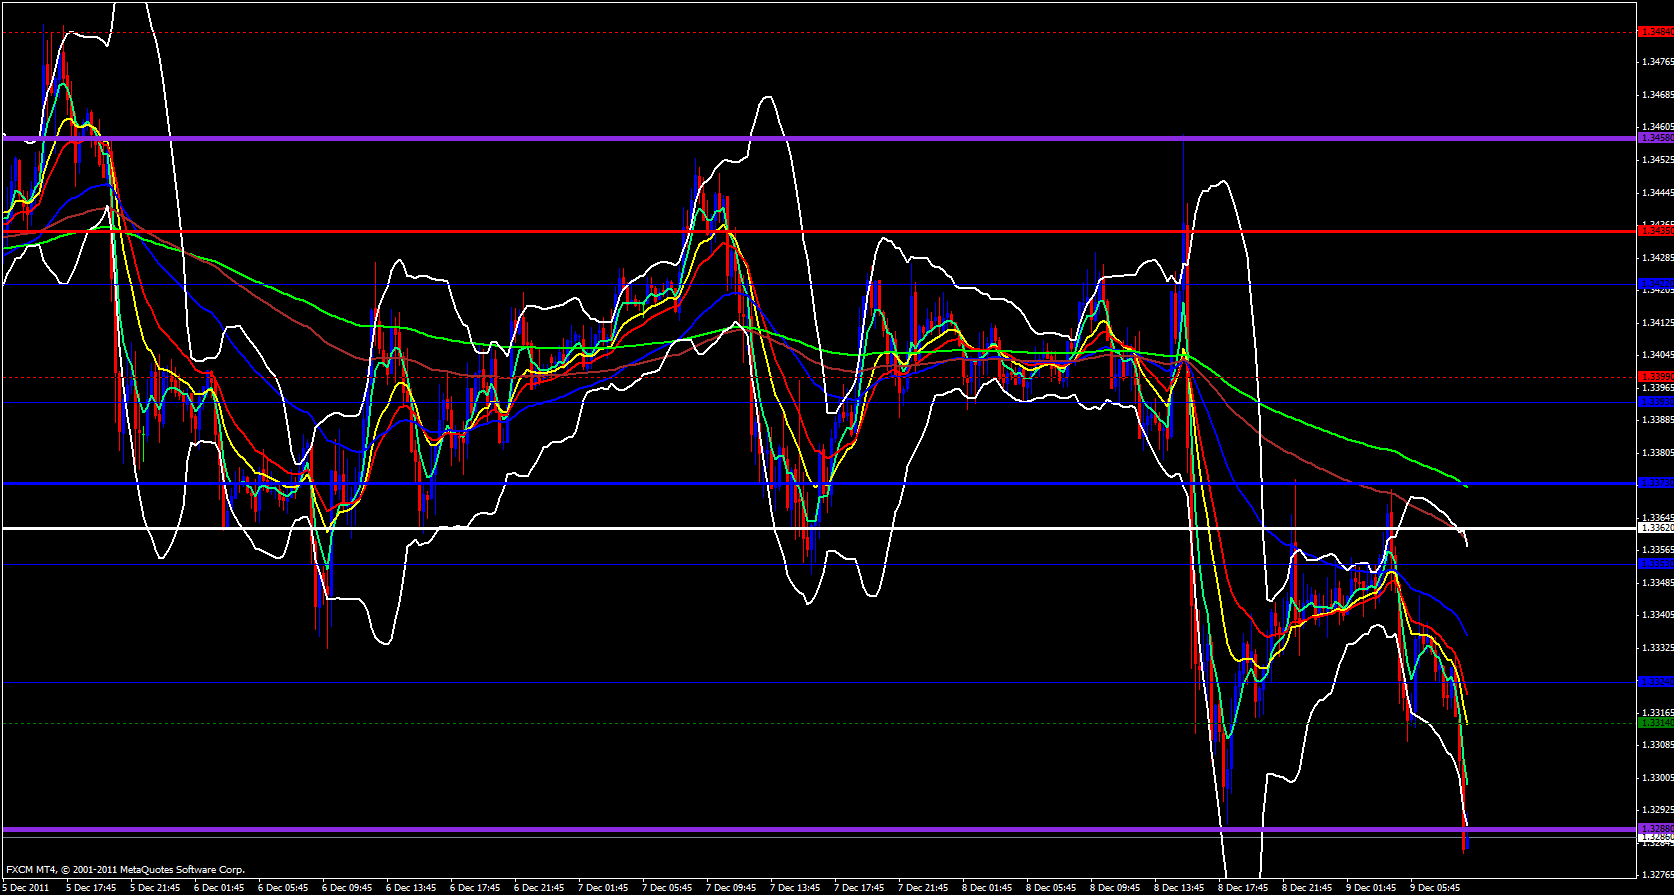
On the 15 minute time frame price looks extremely bearish, price is riding the 5 ema to the downside and the lower Bollinger band wide open sharply pointing down. Price is below the daily central pivot point at 1.3362 and dropping. I expect a bounce off the daily S1 at 1.3265 which will offer an opportunity to find a short position.


