By: Doug Rosen
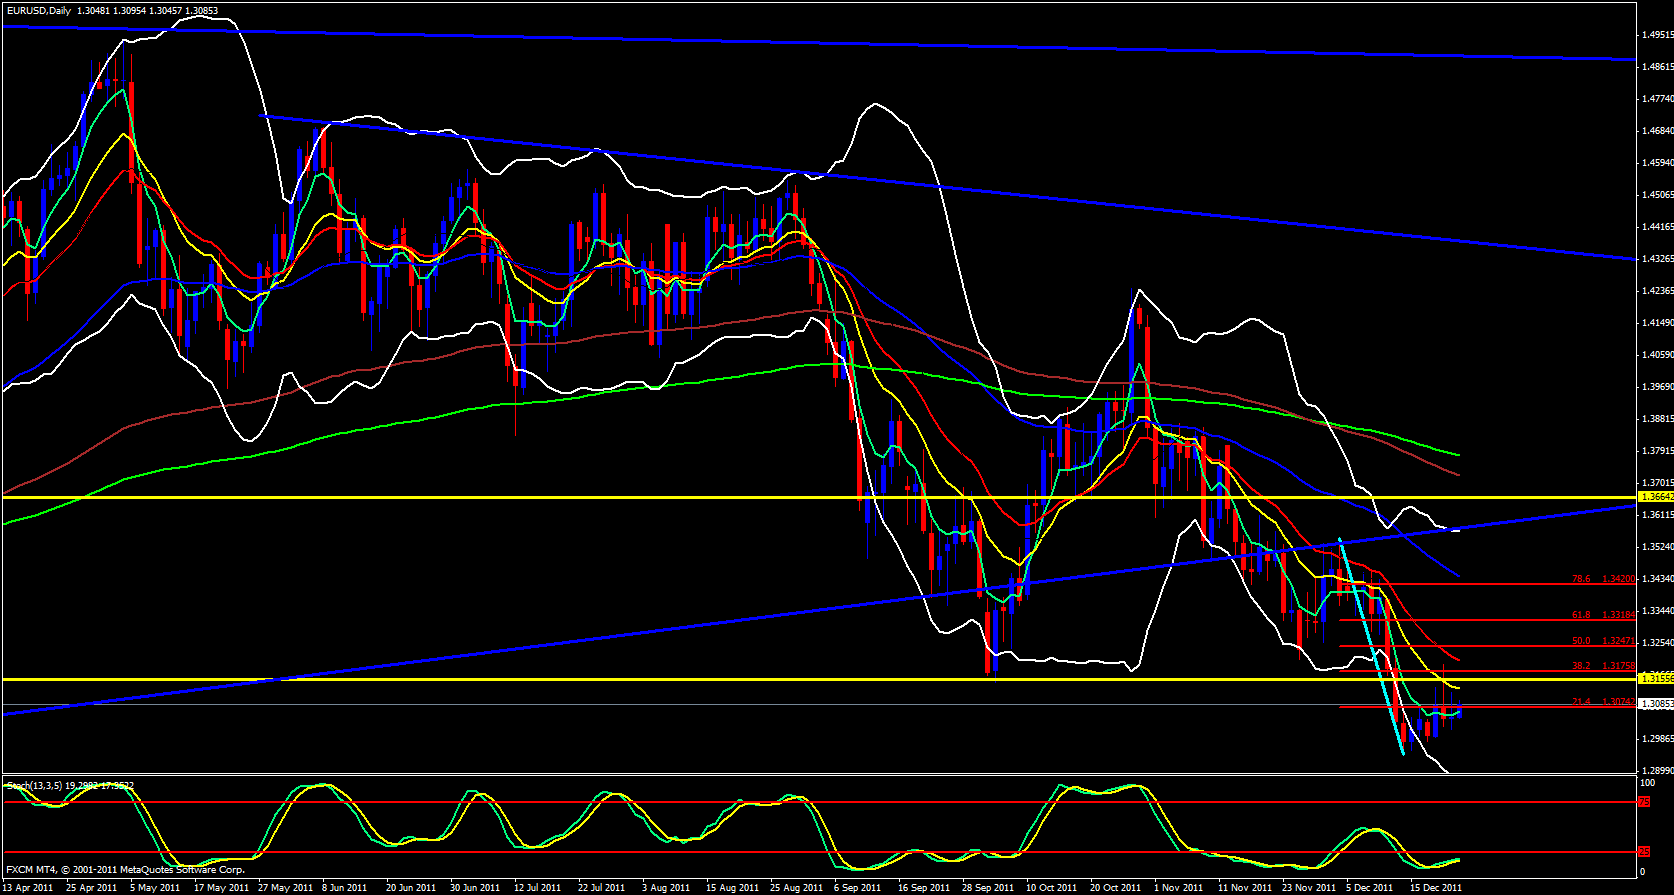
Yesterday was a very interesting day for the EUR/USD as it was with a few other pairs. Yesterday's daily candle for the EUR/USD was a Doji as it was with the EUR/GBP and the USD/CHF. The EUR/USD moved 102 pips which is a normal day for this pair but price opened and closed just 3 pips of each other. In this case I believe the area of support that caused yesterday's bounce was the monthly 144 ema. Yes, the monthly. On top of that the weekly and daily stochastics has been in the oversold zone. So normally, when this occurs a retracement follows.
On the daily time frame price has managed to make its way above the 5 ema and a couple higher lows have occurred. This will not be an easy retracement since the 13 ema stands in the way before we will get to the 38.2 fib and there is some tough visual resistance just before the 38.2 at 1.3156 but the the 38.2 will be a perfect place to enter shorts since that is where the 21 ema will be and the daily 21 ema has not been truly broken since early November.
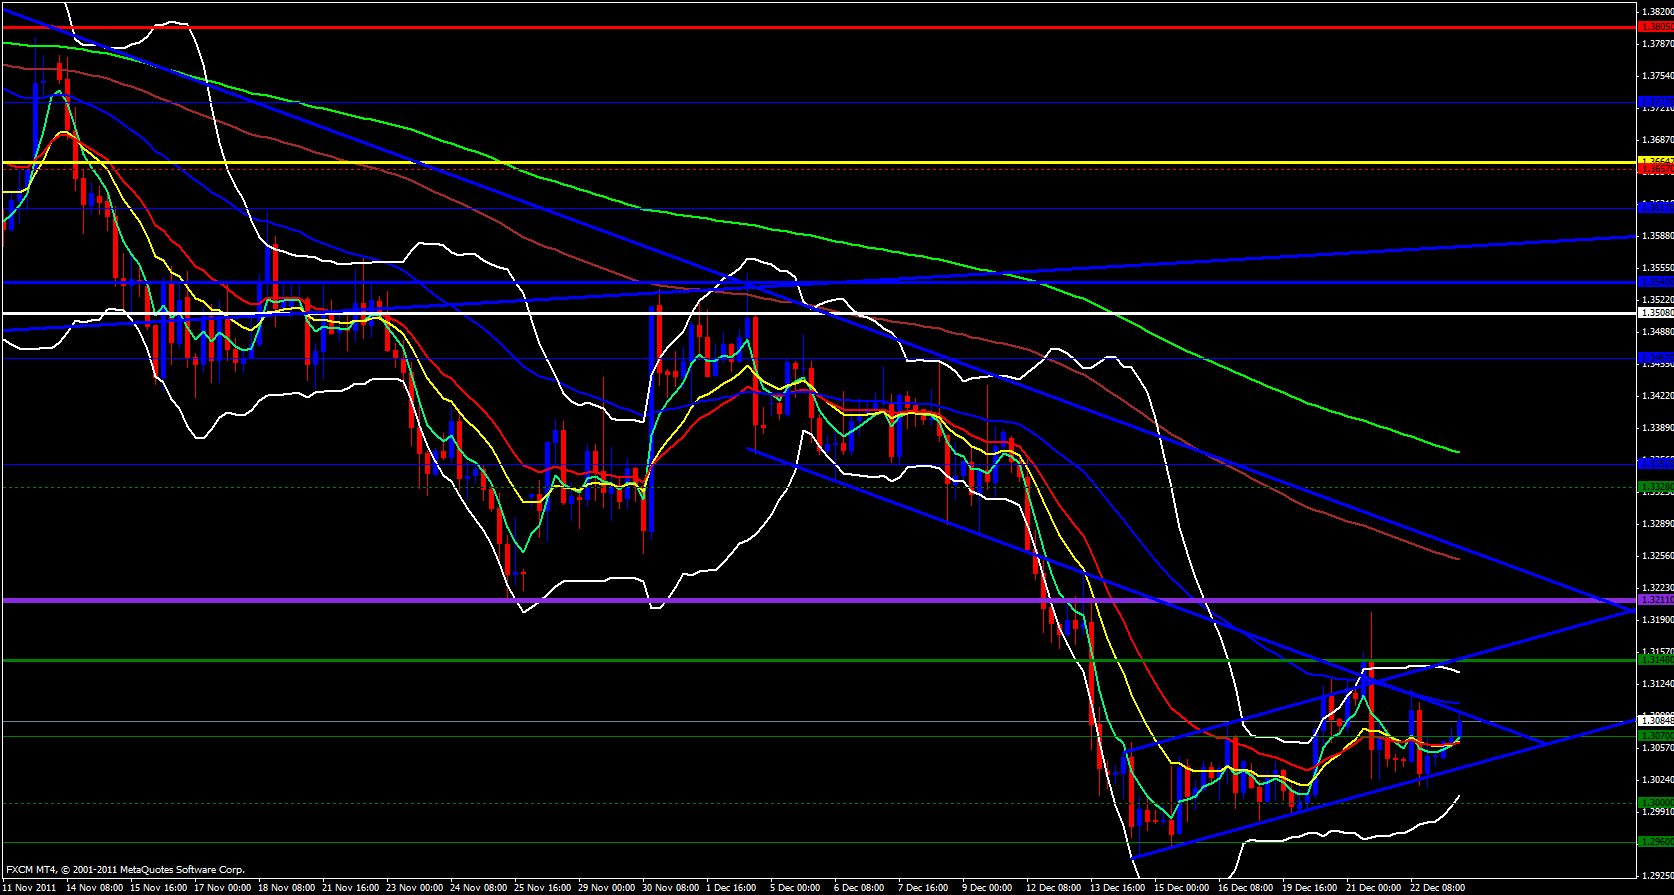
On the 4 hour timeframe price is in the nose of a triangle trap and the past few candles we have been getting higher lows so energy to the upside is present. The 5 ema appears to be wanting to cross above the 21 and 13 ema's so price looks like it does want to head up. Of course, since today is the last trade day of the week and just before the Christmas weekend I expect thinner than usual market conditions since the heavy hitters of the market have already begun their Christmas vacations.
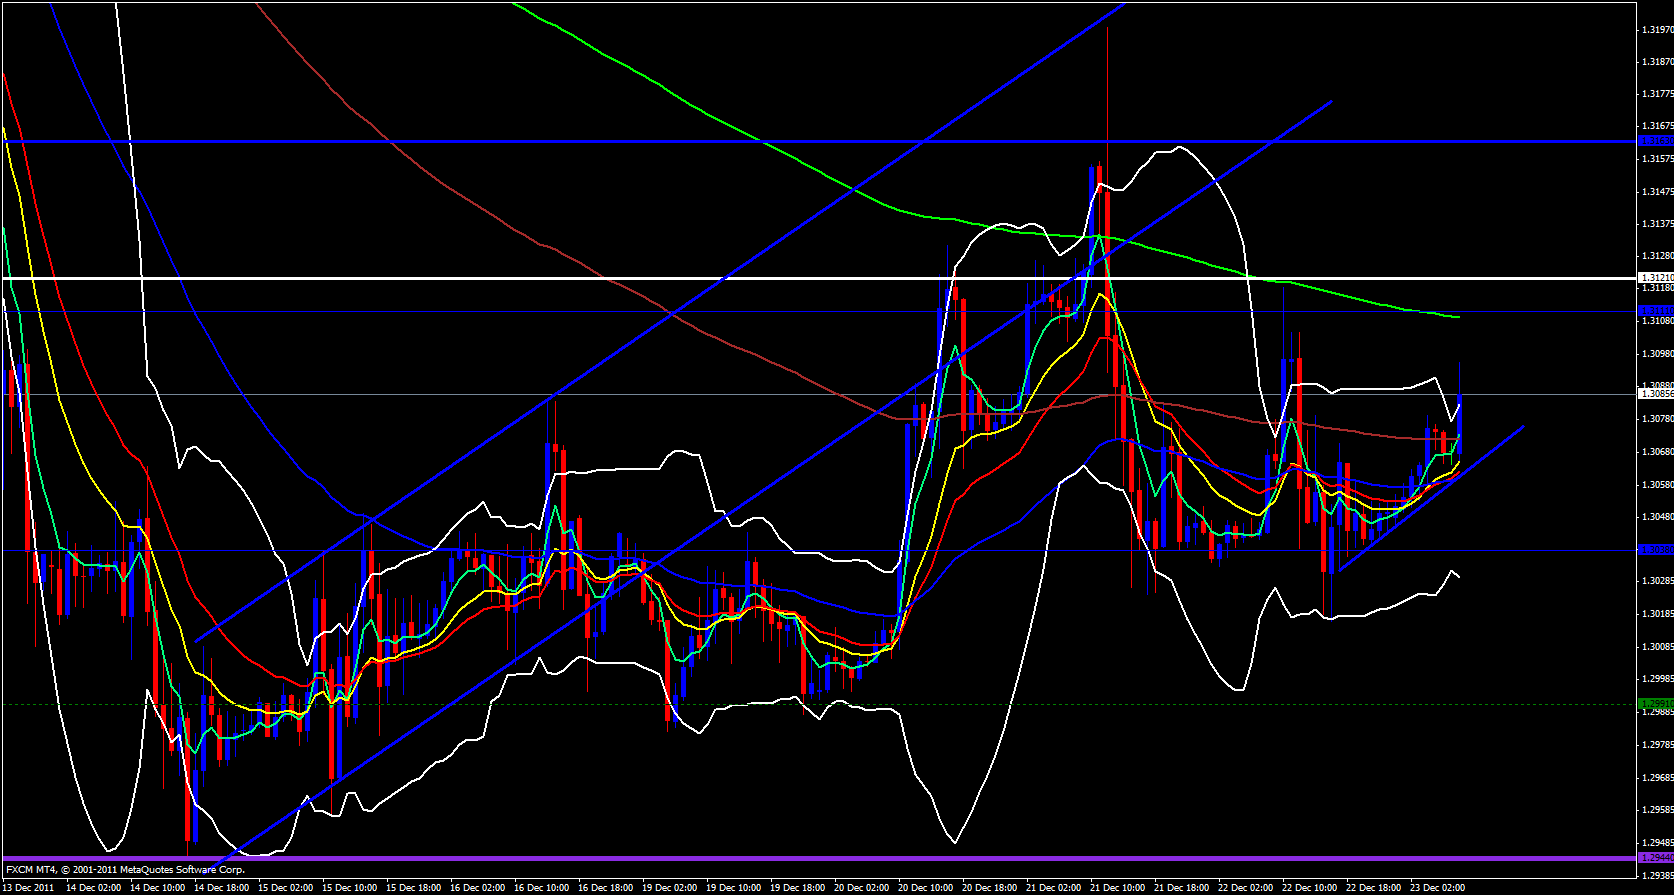
On the hourly timeframe it is obvious price is heading up, but it seems to be having a fight with the 144 ema which it did breach and retest and I do expect it will be broken totally and price will rise. The 4 hour upper Bollinger band is opening up and pointing up.
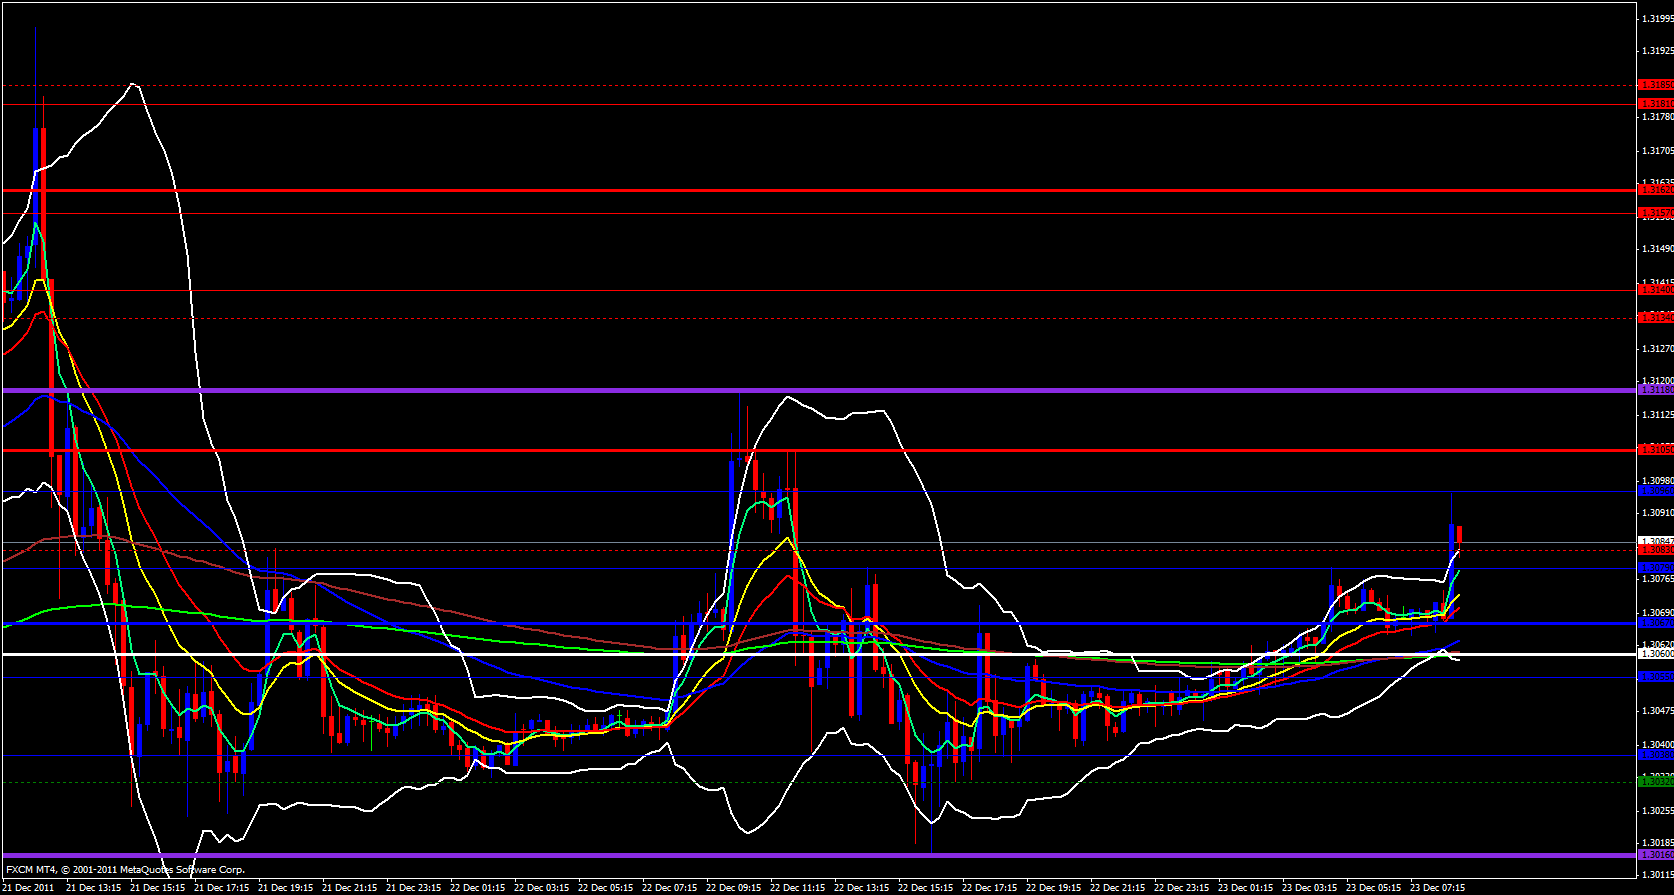
The 15 minute time price actions is rising slowly but surely but the Bollinger bands are very narrow and the ema's are all bunched together indicating very little to no volatility.
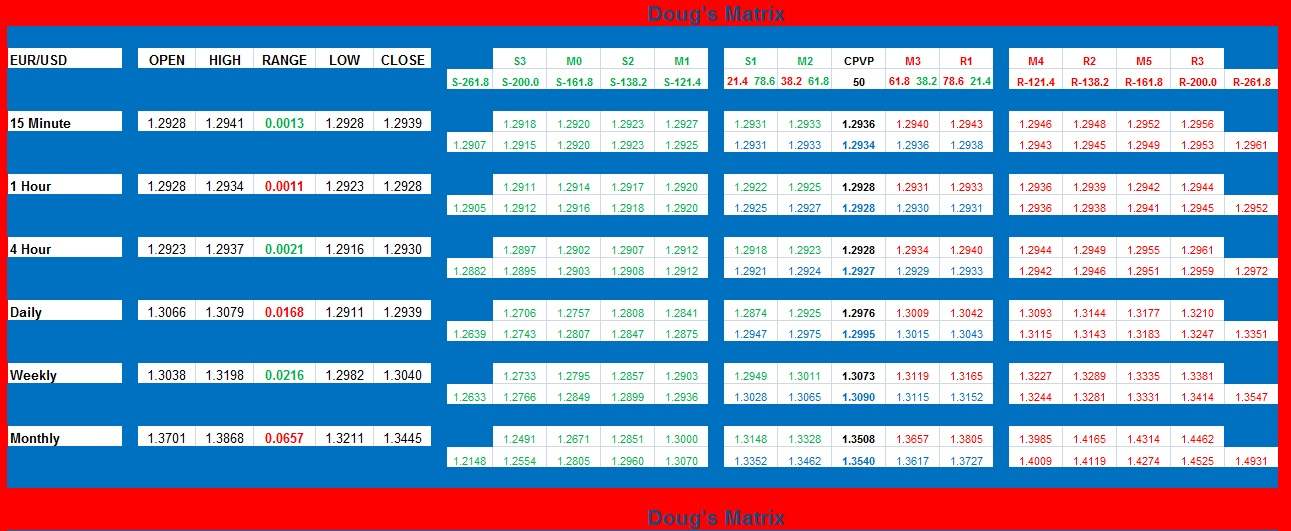
In any case, I am a bull today and do expect that if today is not a range bound day it will be a bullish day for this pair. Included in my analysis is my custom made Support & Resistance Matrix which points out the various levels of support and resistance over multiple timeframes mathematically based on Pivot Point and Fibonacci theory so keep an eye on those price levels prior to entering any positions. It may save you from entering longs at resistance or entering shorts at support.


