By: Doug Rosen
The EUR/USD had another highly volatile day yesterday. Yesterday's range was 174 pips, a very impressive day for this pair. Price tanked yesterday but before it tanked it rose and on the weekly time frame price rose to the 5 ema which is what made it tank.
For those of you that have been following my analysis daily you should all know by now the power of the 5 ema especially on the larger time frames. I have written over and over the importance of price to tag the 5 ema in order to pick up renewed energy to continue on its trend. Well, it did, just as I said it would in yesterday's analysis and sure enough, it tanked just as I said it would. At the same time when weekly price touched the 5 ema on the daily time frame price rose close to the 21 ema which overlapped with the 38.2 fib of the swing down.
On the 4 hour time frame price is back within the wedge trap it had been in and it is now a matter of which way it will break but it looks more bullish than bearish due to the series of higher lows it has been making.
On the hourly time frame however, I see a slightly different picture. Price is not too far below the 144 ema at 1.3077 with the upper Bollinger band shadowing it and the upper and is dropping and pointing straight down and not too much further above that is the 38.2 fib of yesterdays drop.
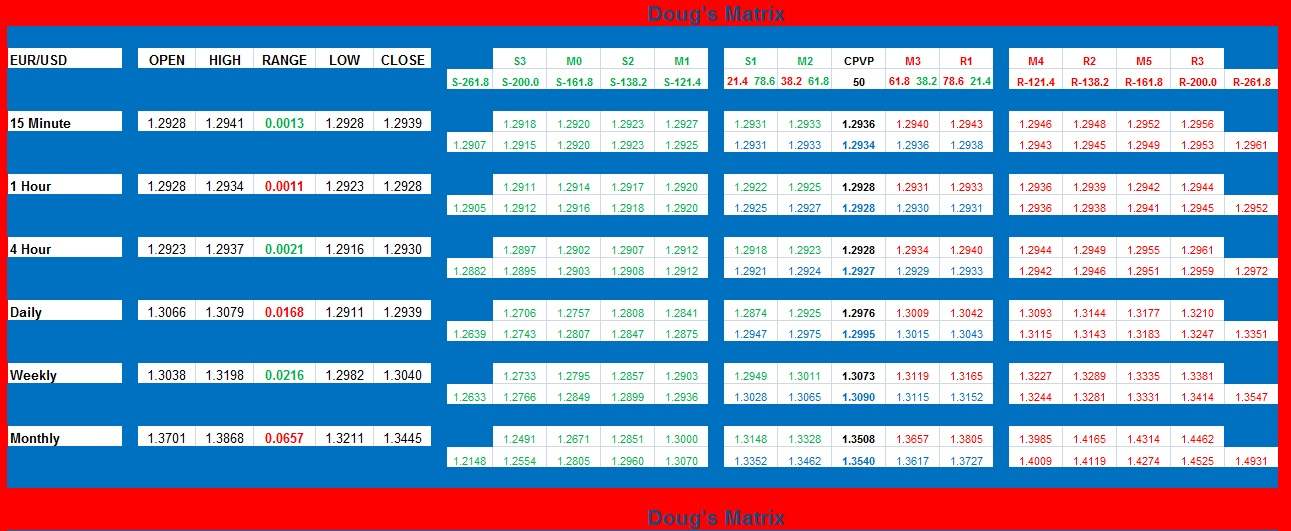
Finally on the 15 minute time frame price is trying to rise and is breaking above the 144 ema and the upper Bollinger band is opening to the upside. The daily central pivot point is at 1.3090 and this is a very bearish pivot point since it is overlapped with the 38.2 fib of yesterdays range. So, a break above 1.3090 then a retest I am bullish. A drop below 1.3024 I am bearish.
Included in my analysis from now on is my custom made Support and Resistance Matrix of my own personal design. It is complex but will provide you with all the possible support and resistance areas to watch out for. This is strictly a mathematical based system that calculates Pivot Points and Fibs over multiple time frames.


