By: Doug Rosen
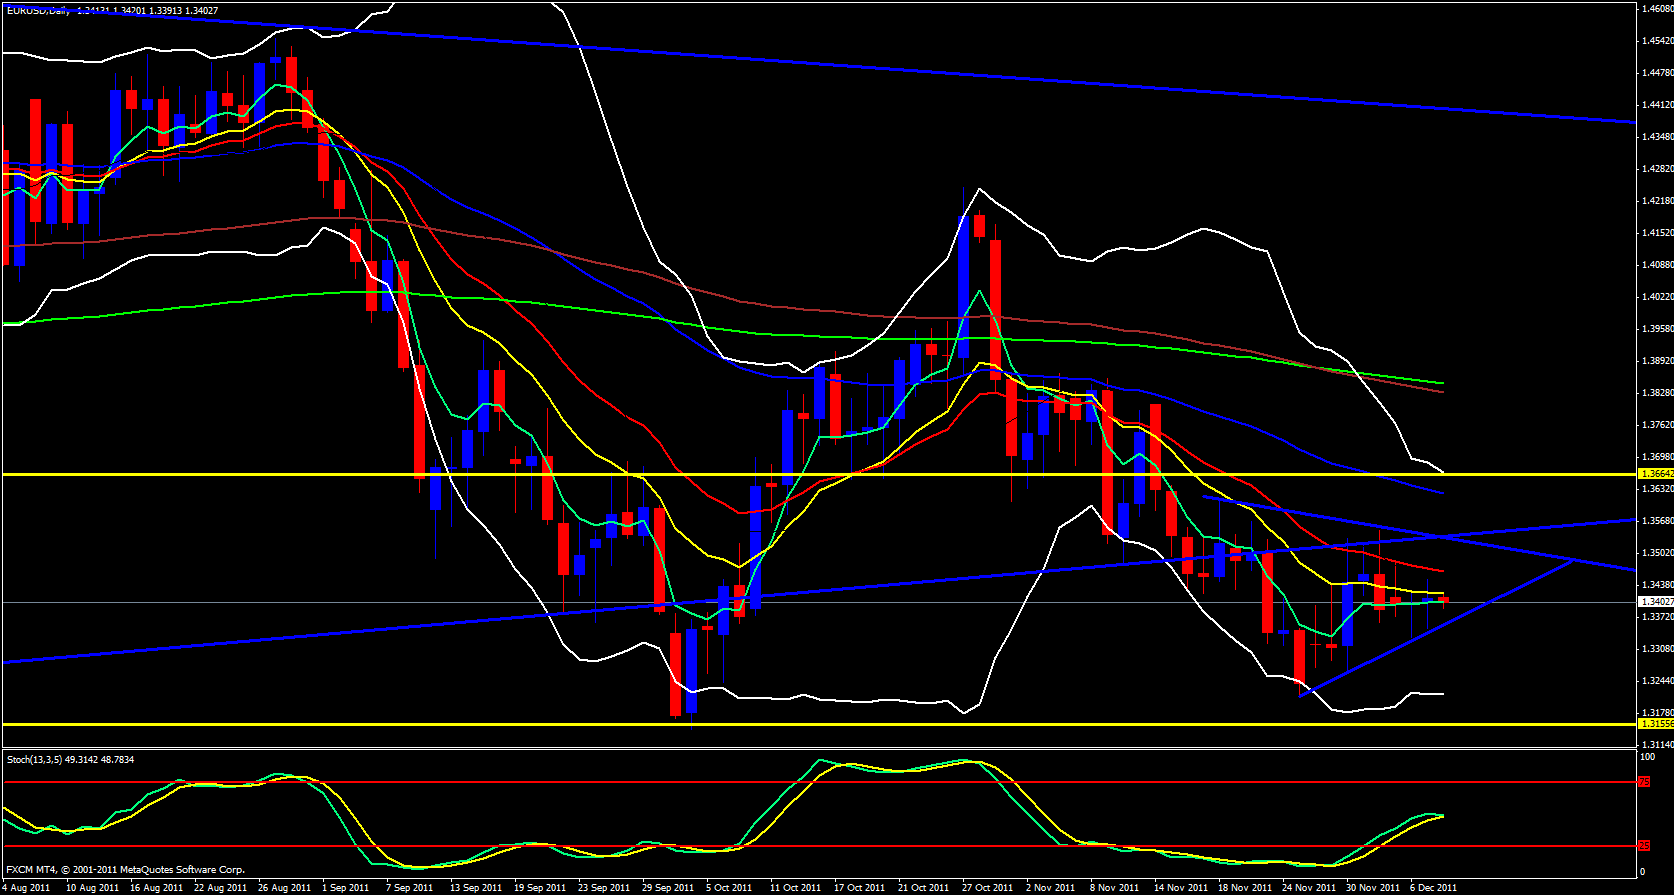
The EUR/USD begins its day just below the 13 ema. For the last couple days the EUR/USD keeps printing a Doji candle. I am long term bearish for this pair bit on the short terms it has been a little unpredictable. The daily stochastics looks like it wants to cross down and price is also below the 21 ema. Price is still caught in the same daily triangle price trap it was in yesterday and I would very much like to see a break to the downside.
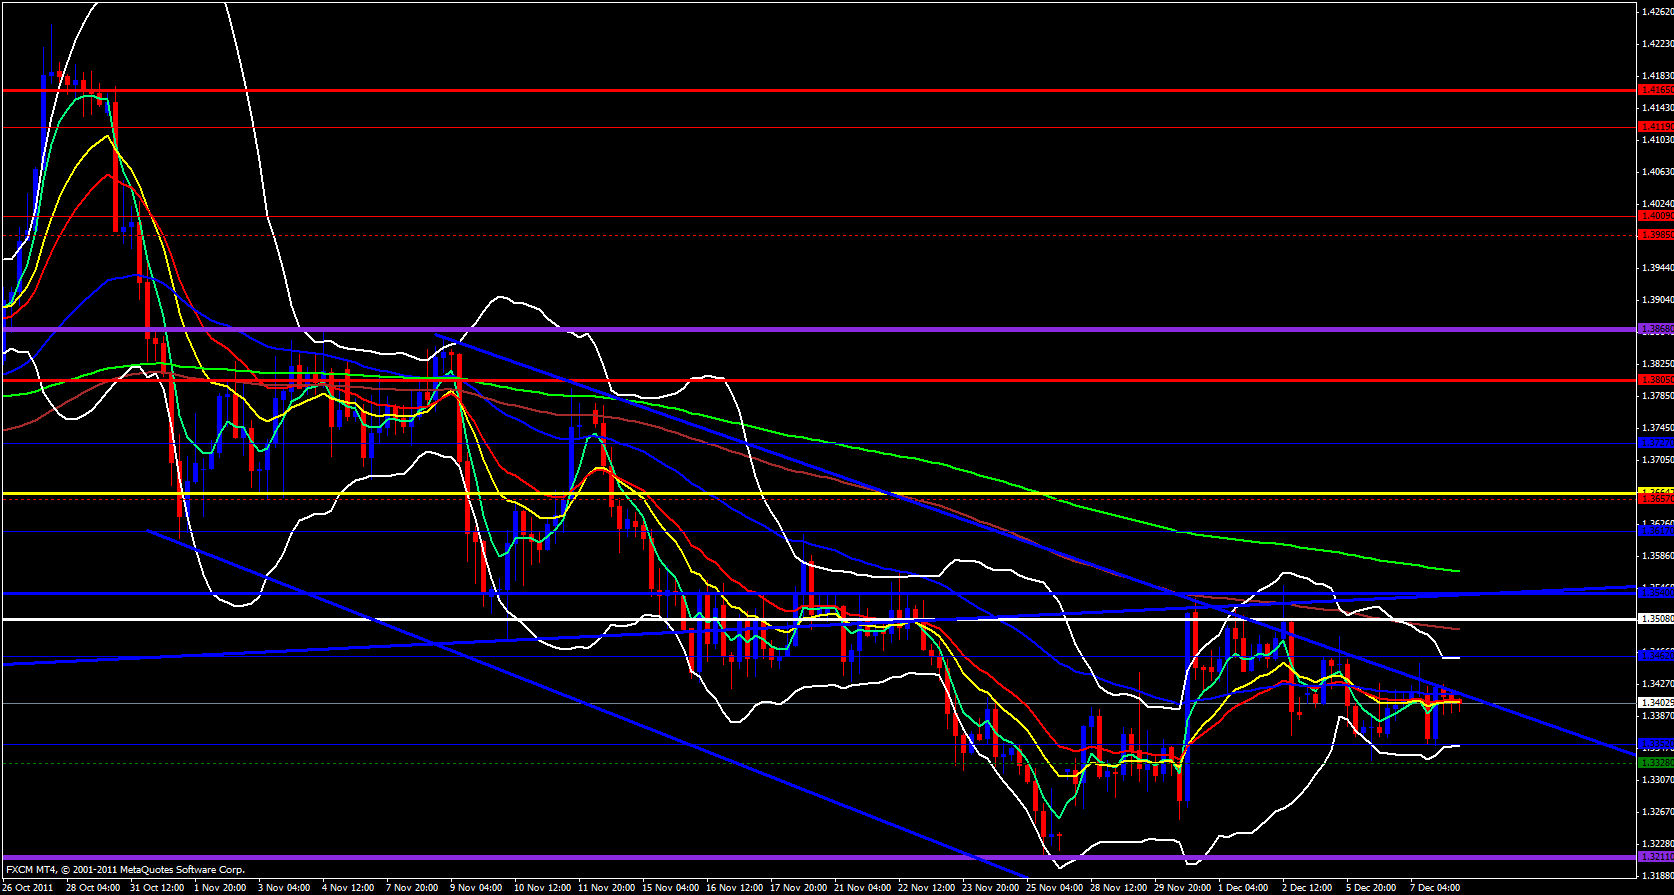
On the 4 hour time frame price is still within the price channel it has been in since November and is at the very top. On the 4 hour price has made a few series of lower highs and a couple lower lows. It is still hard to say if price will break out of the channel to the upside or just start heading down towards the bottom of the channel. On the 4 hour price is still below the 55 ema but the 5, 13 and 21 ema's are all bunched together indicating very low volatility.
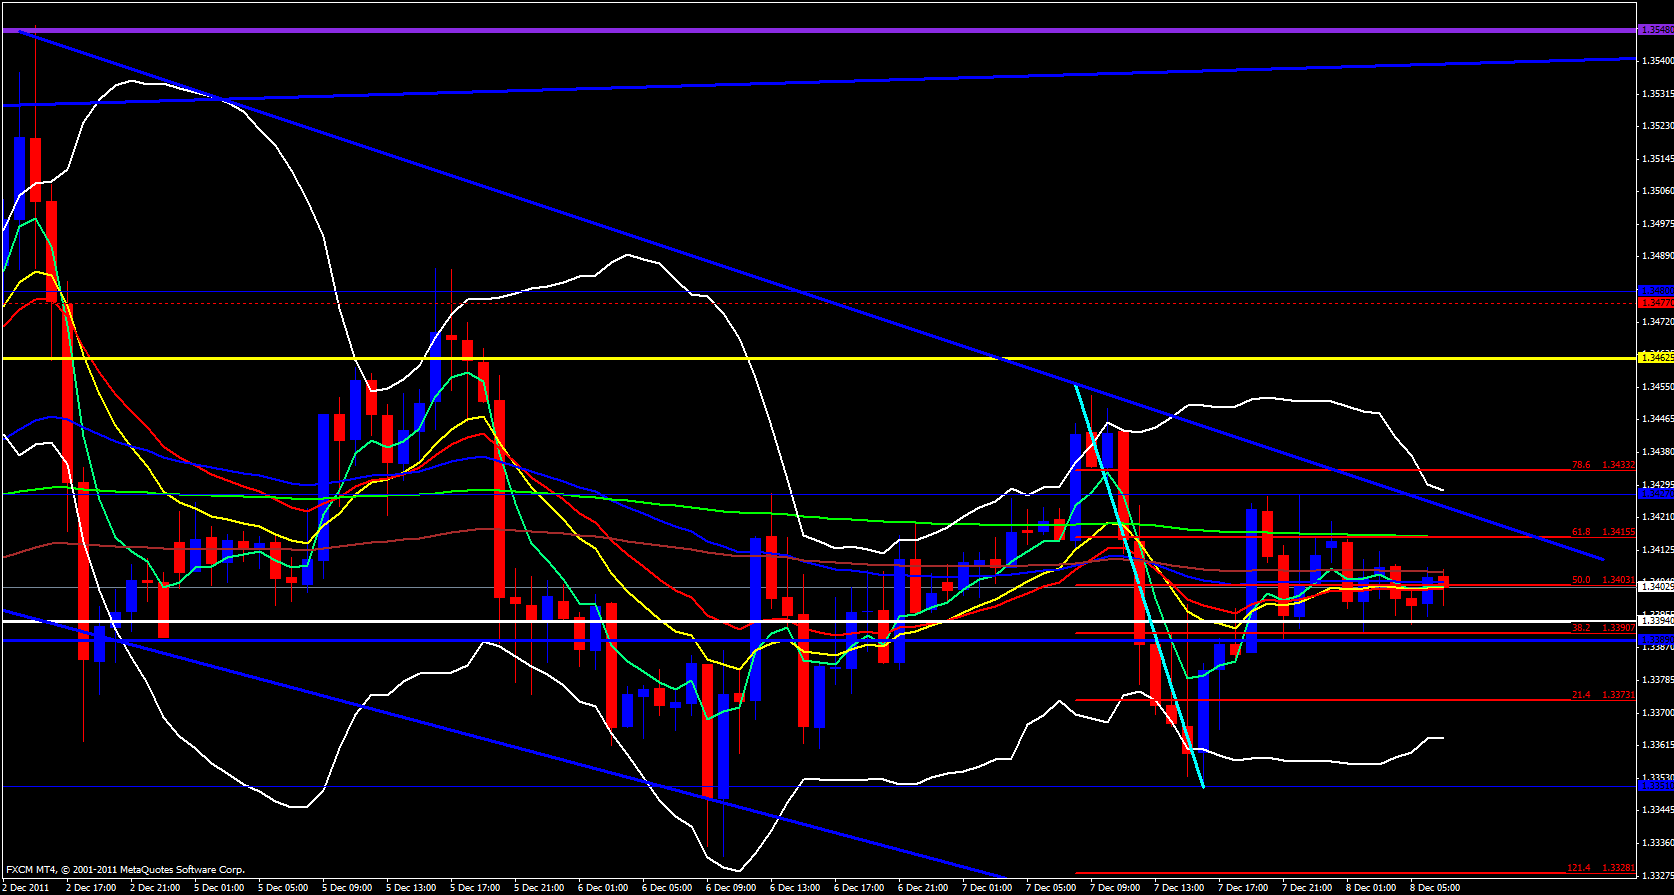
On the hourly time frame I have price confined in yet another triangle price trap and price action is in the nose portion of the trap. Price is below the 144 ema which is flat as is the 233 ema and all the other ema's are bunched and braided so not much going on. The weekly central pivot point is not far below price at 1.3394 and the daily pivot point just a bit above current price action is at 1.3404
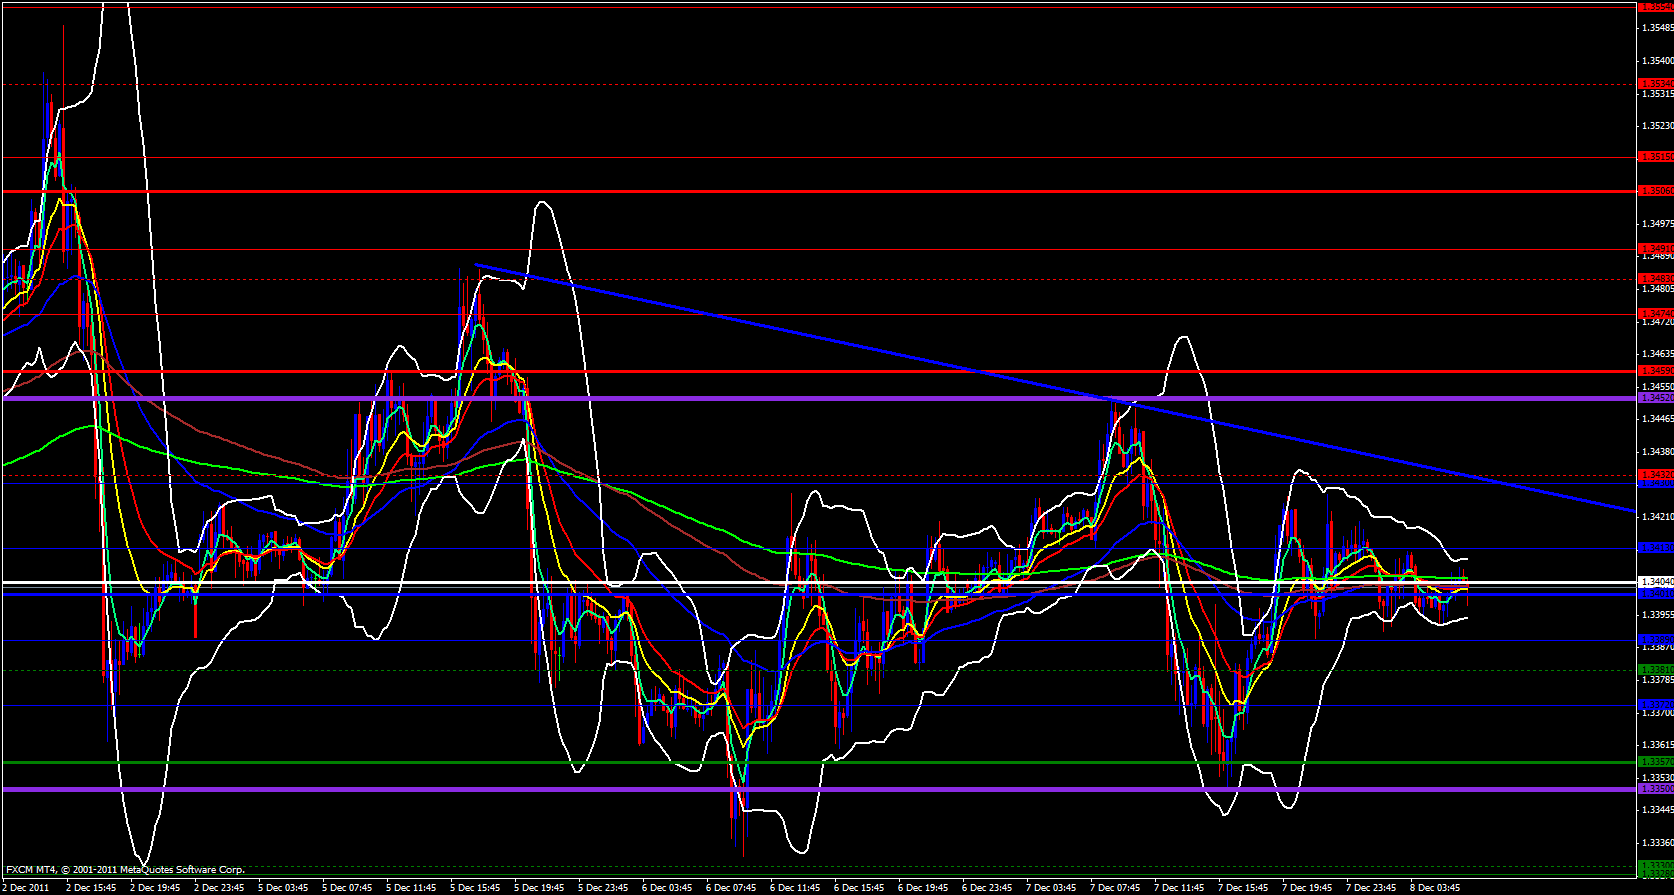
On the 15 minute time frame all the ema's are bunched together and the Bollinger bands are very narrow. Not much volatility for this pair today.


