By: Doug Rosen
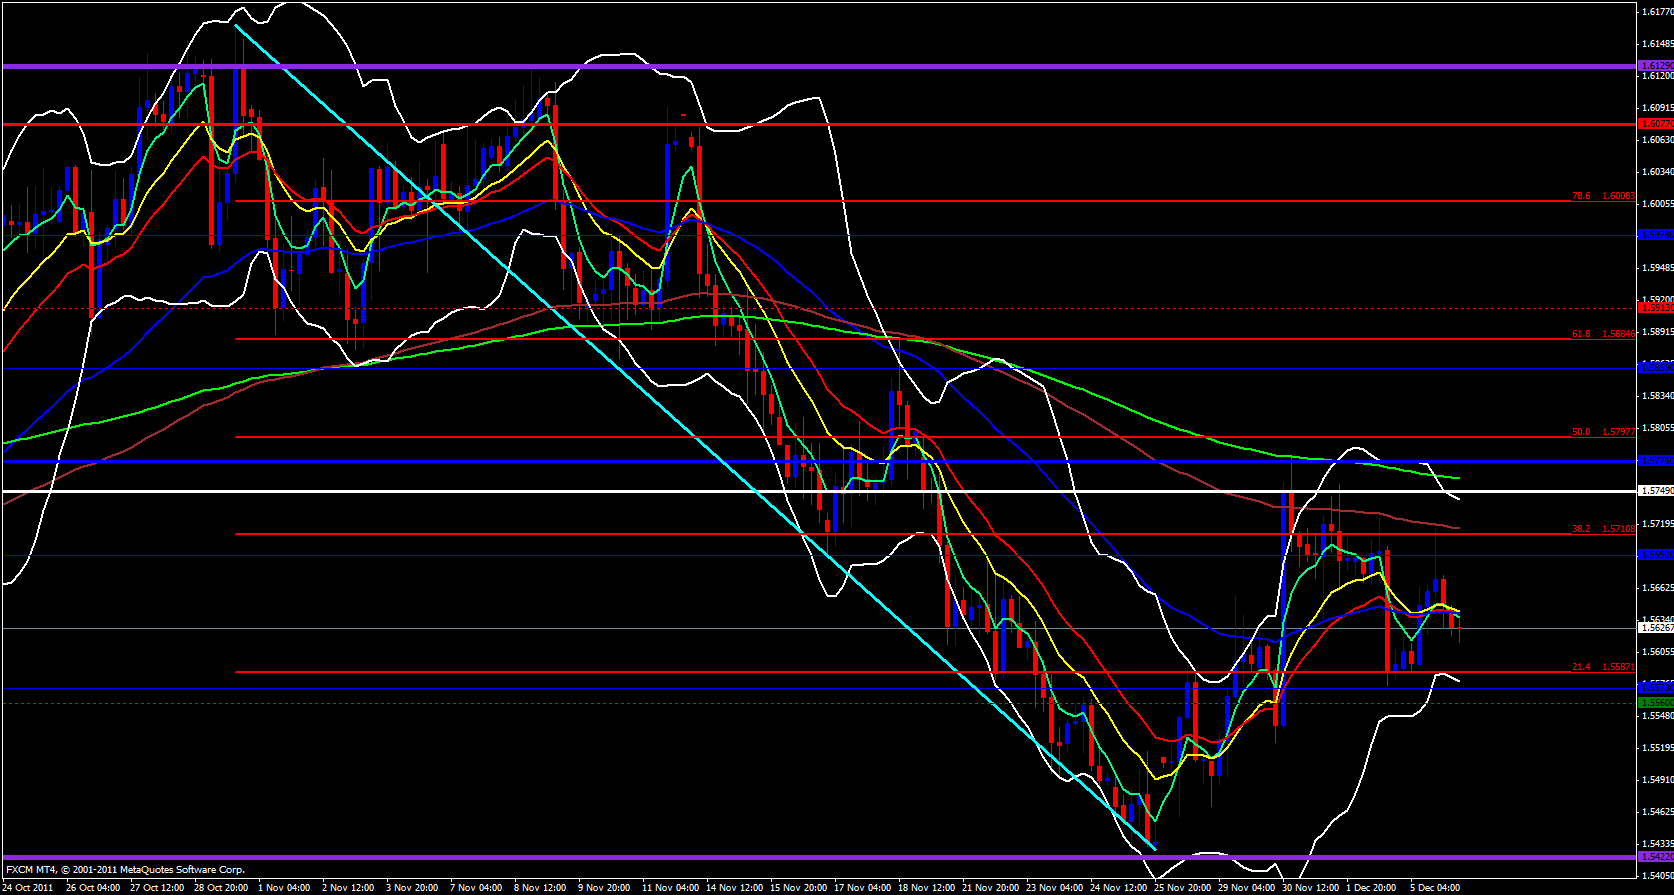
Yesterday the GBP/USD made its way up to the daily 21 ema overlapped with the 38.2 fib then dropped and is still dropping. This just goes to show the power behind fibs and ema's especially when they are overlapped with each other. Today price opened just below the 13 ema and is already slightly below the 5 ema.
On the 4 hour time frame price is sitting on the bottom of a triangle trap that has been respected several times already. On top of that price is riding below the 5 ema and the lower Bollinger band is opening up to the downside. If a breakout to the downside below support was to occur, it will most likely be today and very soon. Price is flat against support but dynamic resistance in the form of ema's is pressing down against price which will most likely force it downward and break support.
On the hourly time frame price is riding the 5 ema downward and has made its way below the mighty 144 ema which has also been crossed by the 5 ema to the downside. The lower Bollinger band is open and pointing down and price is currently sitting on the weekly central pivot point which I expect to be broken today.
Finally, on the 15 minute time frame price is riding nicely along the ema's to the downside. Price has bounced off the daily M2 pivot point and this may very well be the pullback opportunity to enter a short, however, the party hasn't started yet and if there will be a bearish breakout and a down day for this pair, there will be plenty of safe opportunities to enter a position.


