By: Doug Rosen
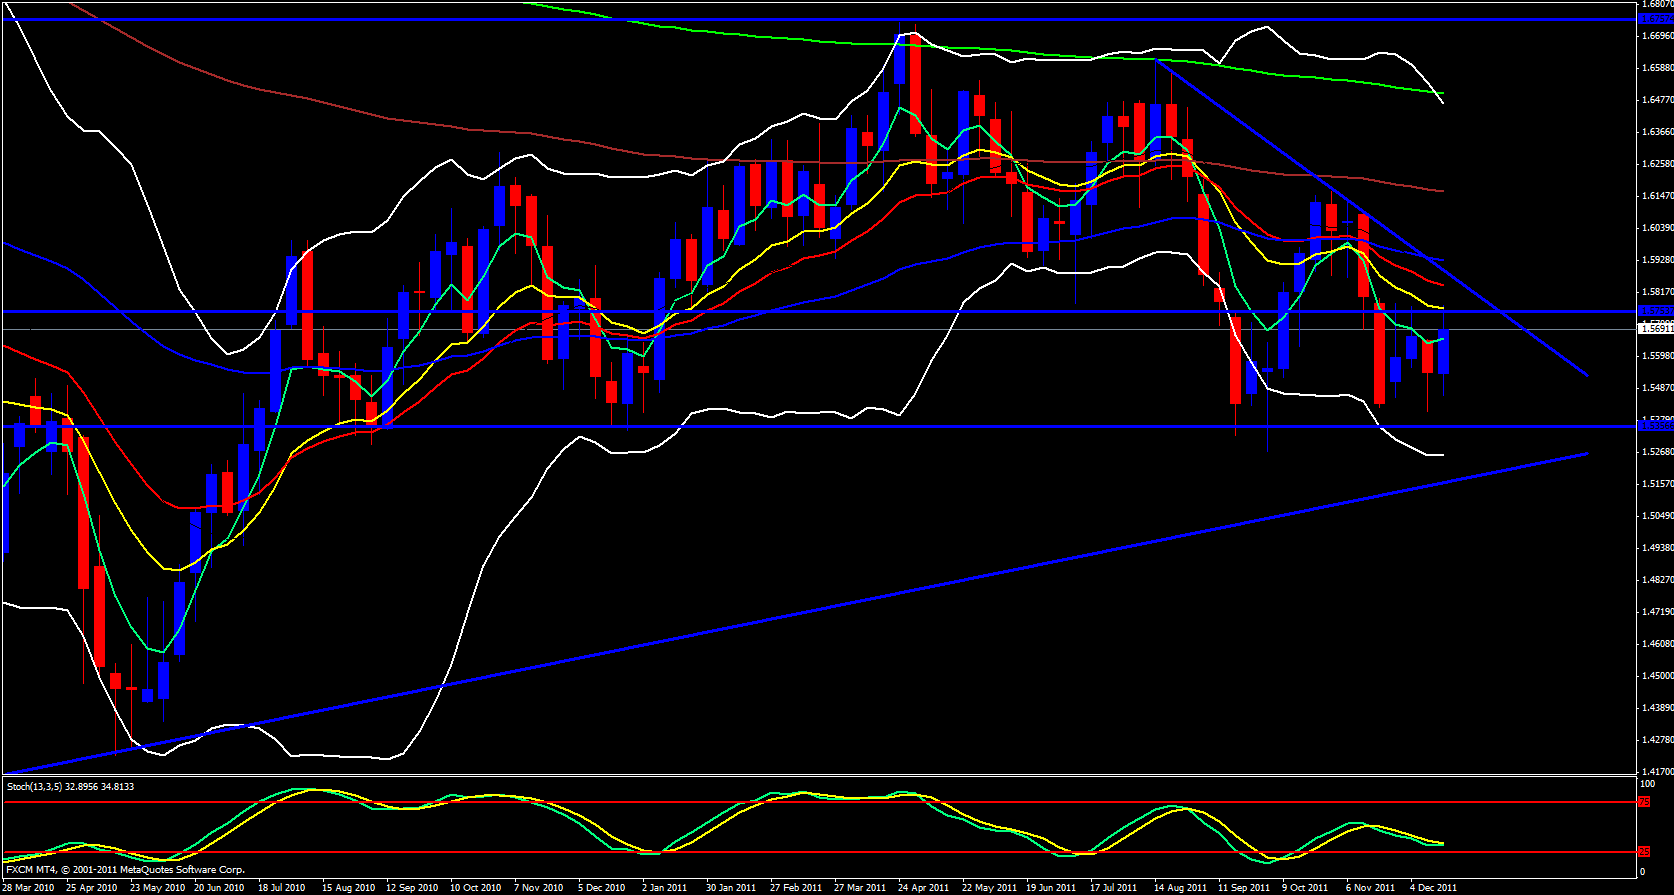
Yesterday was an average day for the GBP/USD pair. Its range was around 126 pips. The weekly candle rose to the 13 ema then price dropped. The 13 ema is very powerful, especially on the larger time frames. When price reached the 13 ema it also reached a strong area of resistance and made a triple top. These are trade setups you should always watch for.
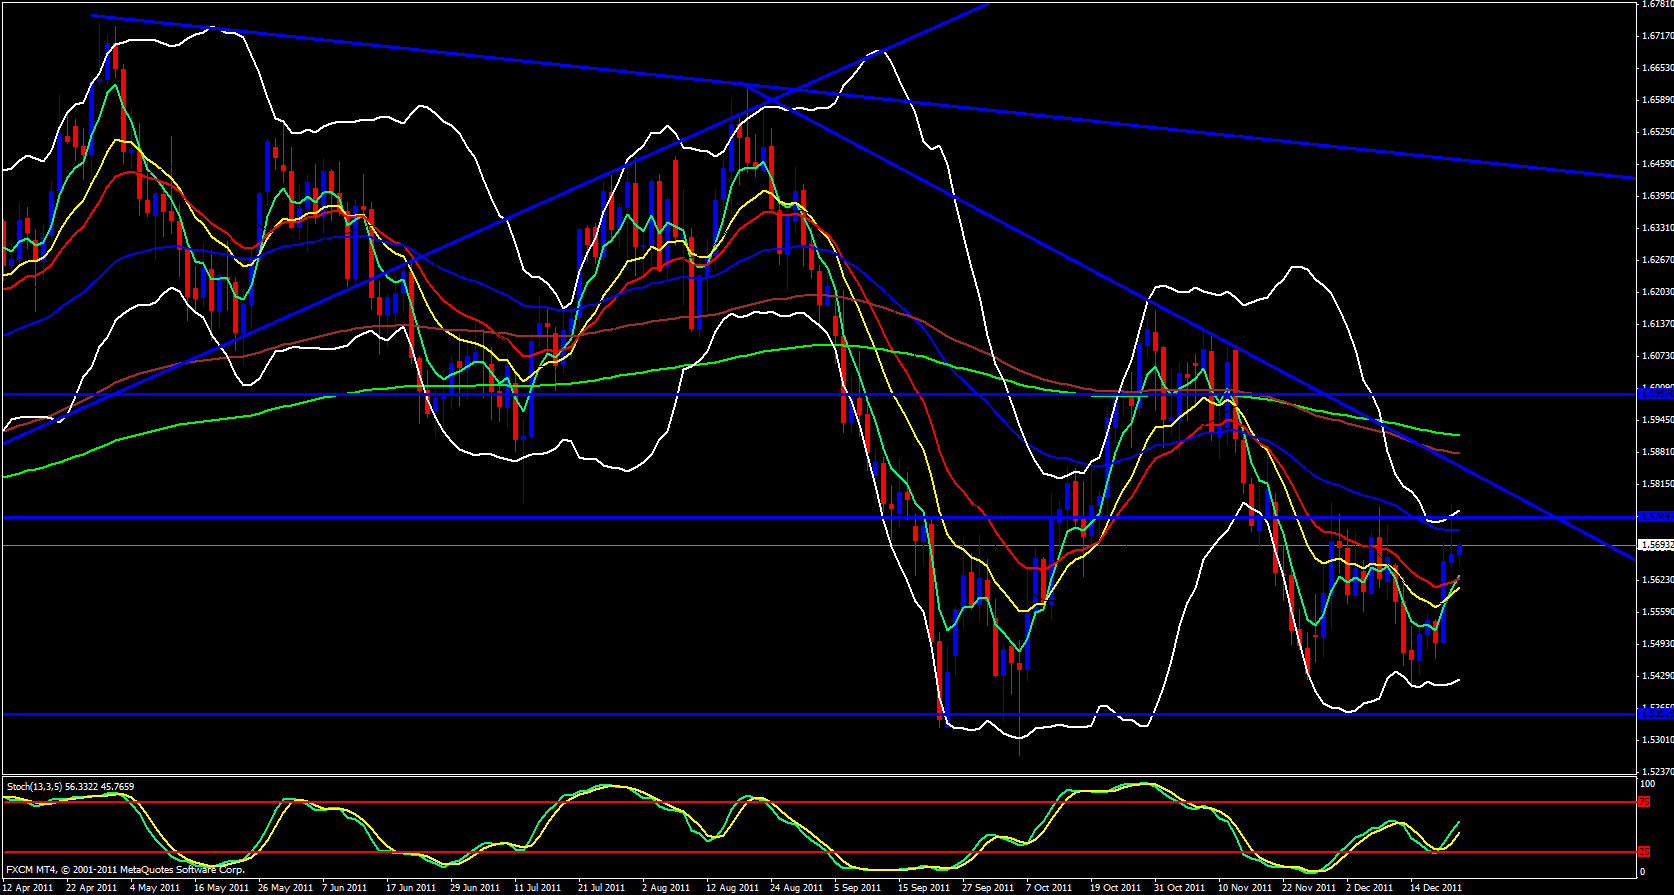
On the daily time frame price is a bit above the ema's which are currently crossing to the upside. The daily 55 ema is just a bit above current price action and price will either touch it and begin to drop or price will bust it and keep heading up to the 144 ema at around 1.5880 I have a feeling it will bust but before that can happen the 5 ema needs to catch up with price to give it the boost it needs to bust through resistance.
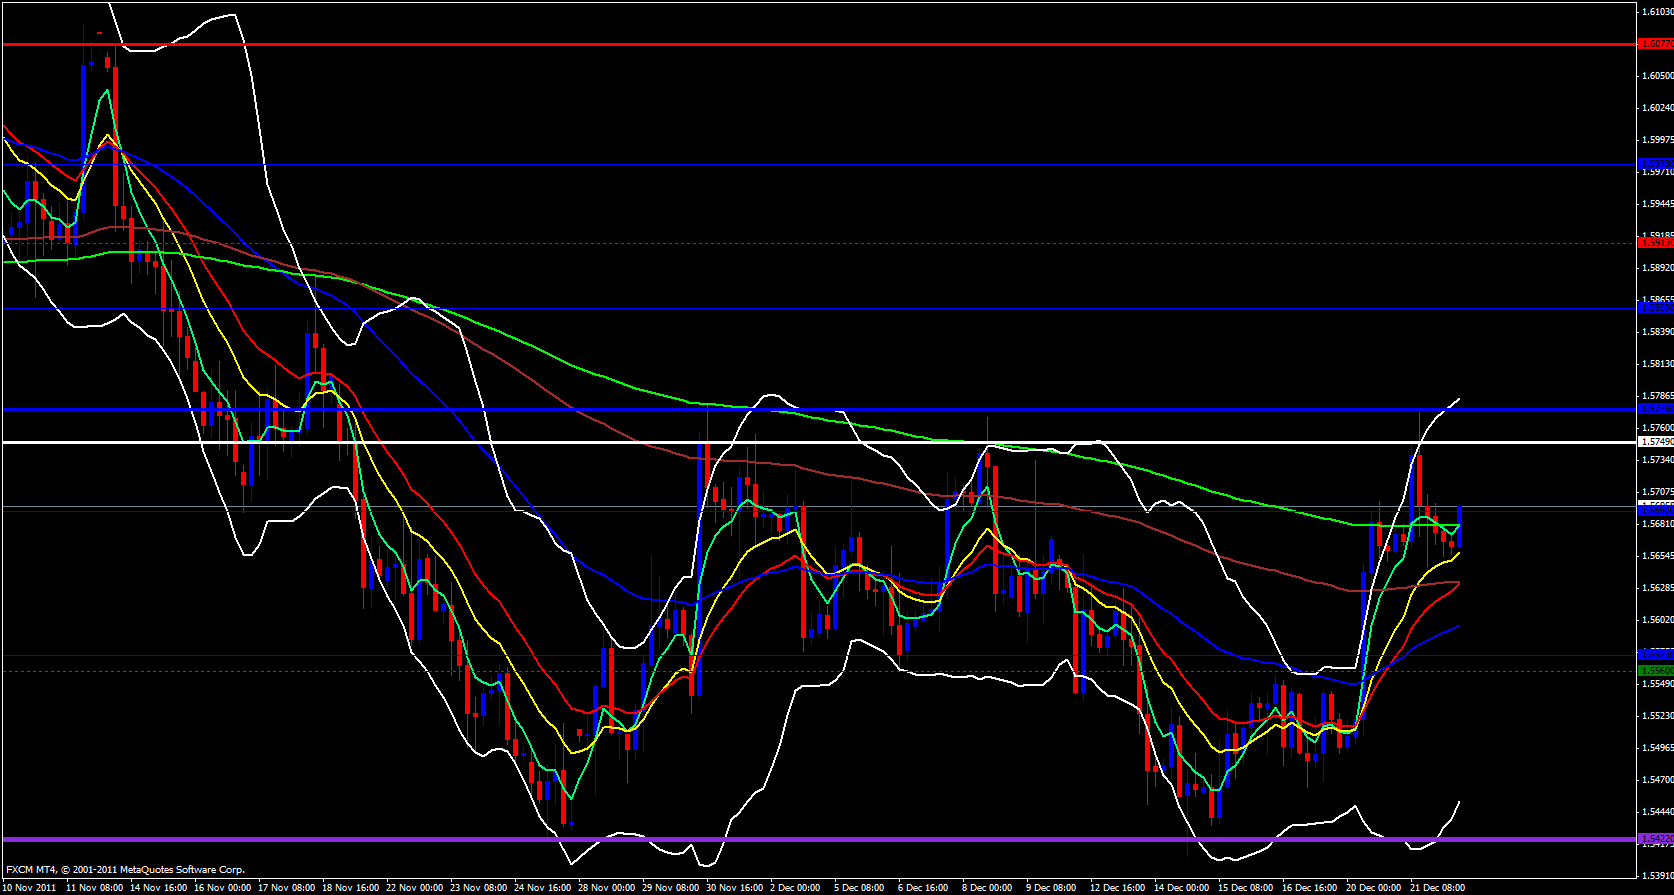
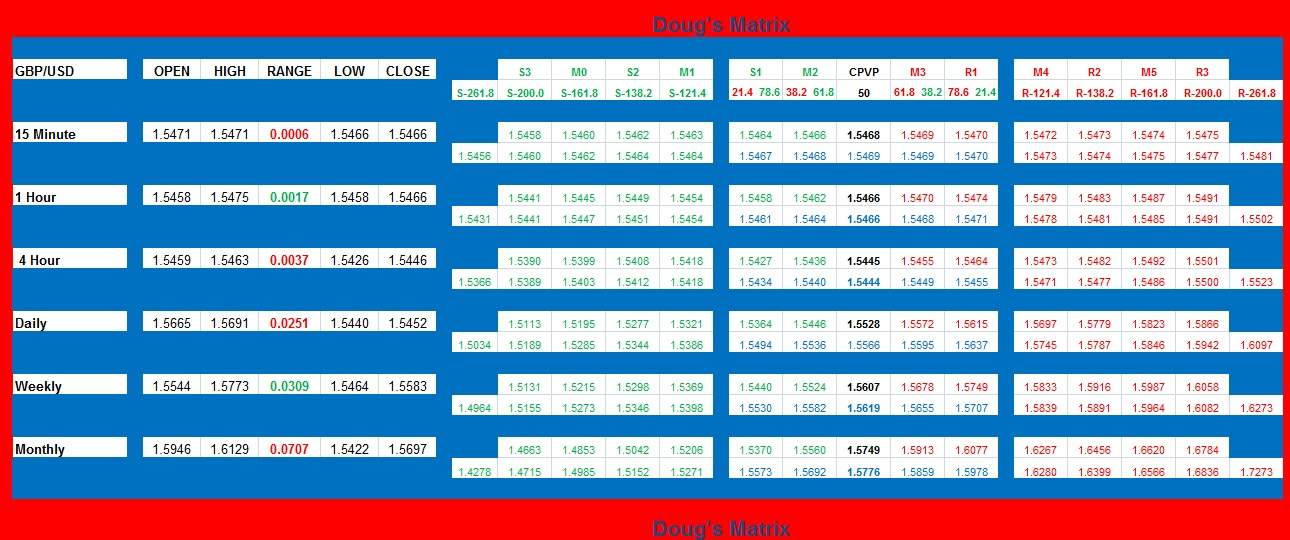
On the 4 hour time frame price is bouncing up off the 13 ema and heading up. The monthly central pivot is at 1.5749 and it is a bearish pivot since it is below the 50.0 fib of last month's range. If it gets busted, price will most likely continue to climb.
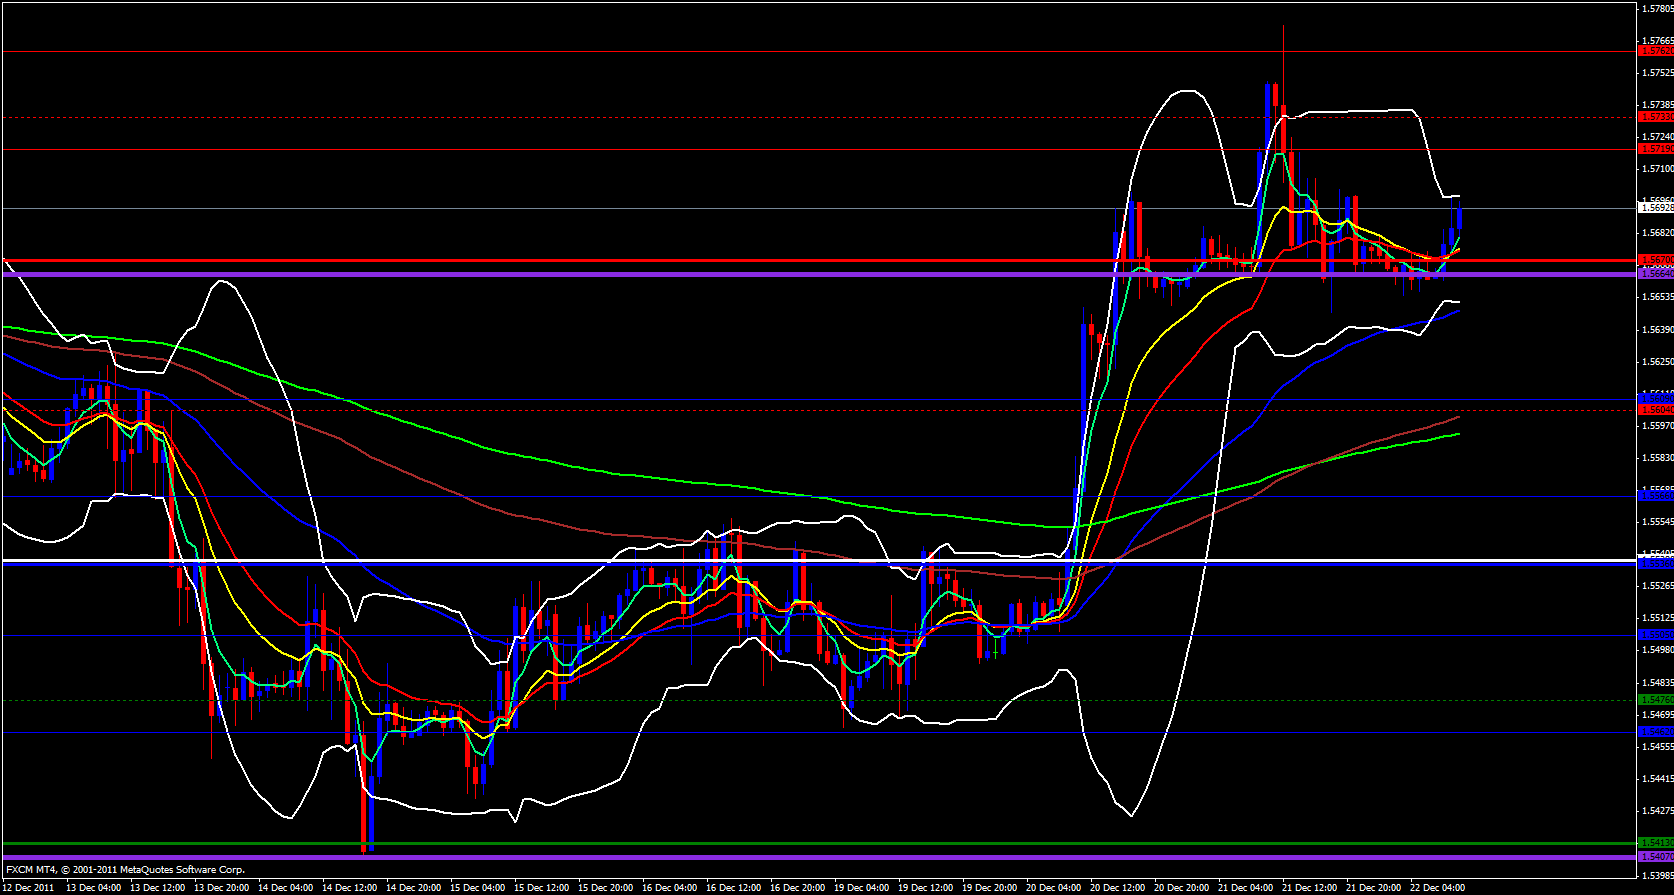
On the hourly time frame price action looks weird. Price has a bullish tone but the Bollinger band is closed. It will need to open for price to move in either direction.
The daily central pivot is at 1.5695 and price is struggling to break above it and even if it does break there is the daily M3 at 1.5721 to deal with and if it breaks that area it should head to 1.5746 and possibly as high as 1.5773 If it breaks below 1.5647 expect a down day and for price to drop to 1.5620 or as low as 1.5570


