By: Doug Rosen
Yesterday the GBP/USD broke below a very strong area of support at 1.5424 It then fell down to another level of support just above 1.5432 then profit taking kicked in and price bounced up and what was support may have reversed roles and may now be resistance and could begin to drop from where it is. The lower Bollinger band has opened and is pointing down. The daily 5 ema has crossed below the 13 and 21 ema's and price has permission to drop.
On the 4 hour timeframe it is apparent price has made the 50.0 fib from its swing down, overlapped with new resistance. Price is just below the 5 ema and it is just below last months low I cannot think anything but down.
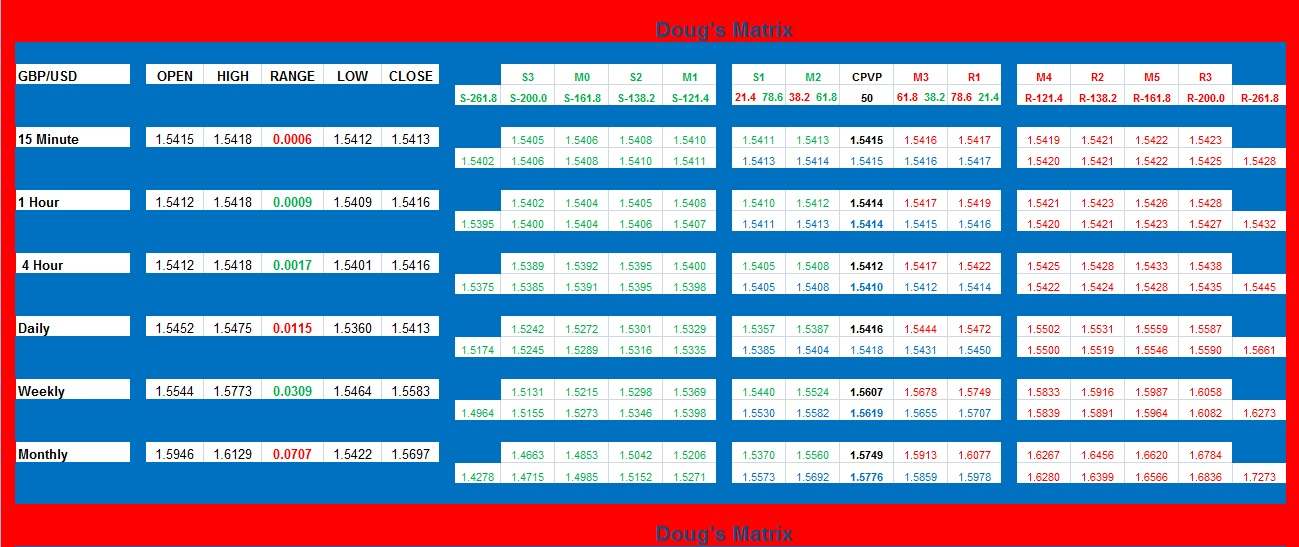
On the hourly timeframe price is just at the 21 ema and below the weekly S1 at 1.5440
On the 15 minute timeframe price is caught inside a Bollinger Band squeeze and price is just below the daily central pivot point and I am confident that price will compress within the Bollinger Bands and drop. Price levels between 1.5440 - 1.5460 are great areas to look for shorts today and 1.5360 will be the best levels to take profit or watch for fades to the upside.
Provided is my Support & Resistance table referred to as Doug's Matrix. It is a very complex calculation system of my own design that displays areas of support and resistance that will most likely be observed by the market. Use it to your advantage. It will get you into safe trades and keep you out of the bad ones.


