By: Doug Rosen
Just like a few other pairs the GBP/USD daily candle was a Doji. It moved a total of 80 pips yesterday but the open and close were only 7 pips apart. On the daily timeframe yesterday price fell down and nearly touched the 5 ema which naturally provides the energy price needs to move, and it did, rose all the way up and touched the 55 ema nearly to the pip then dropped.
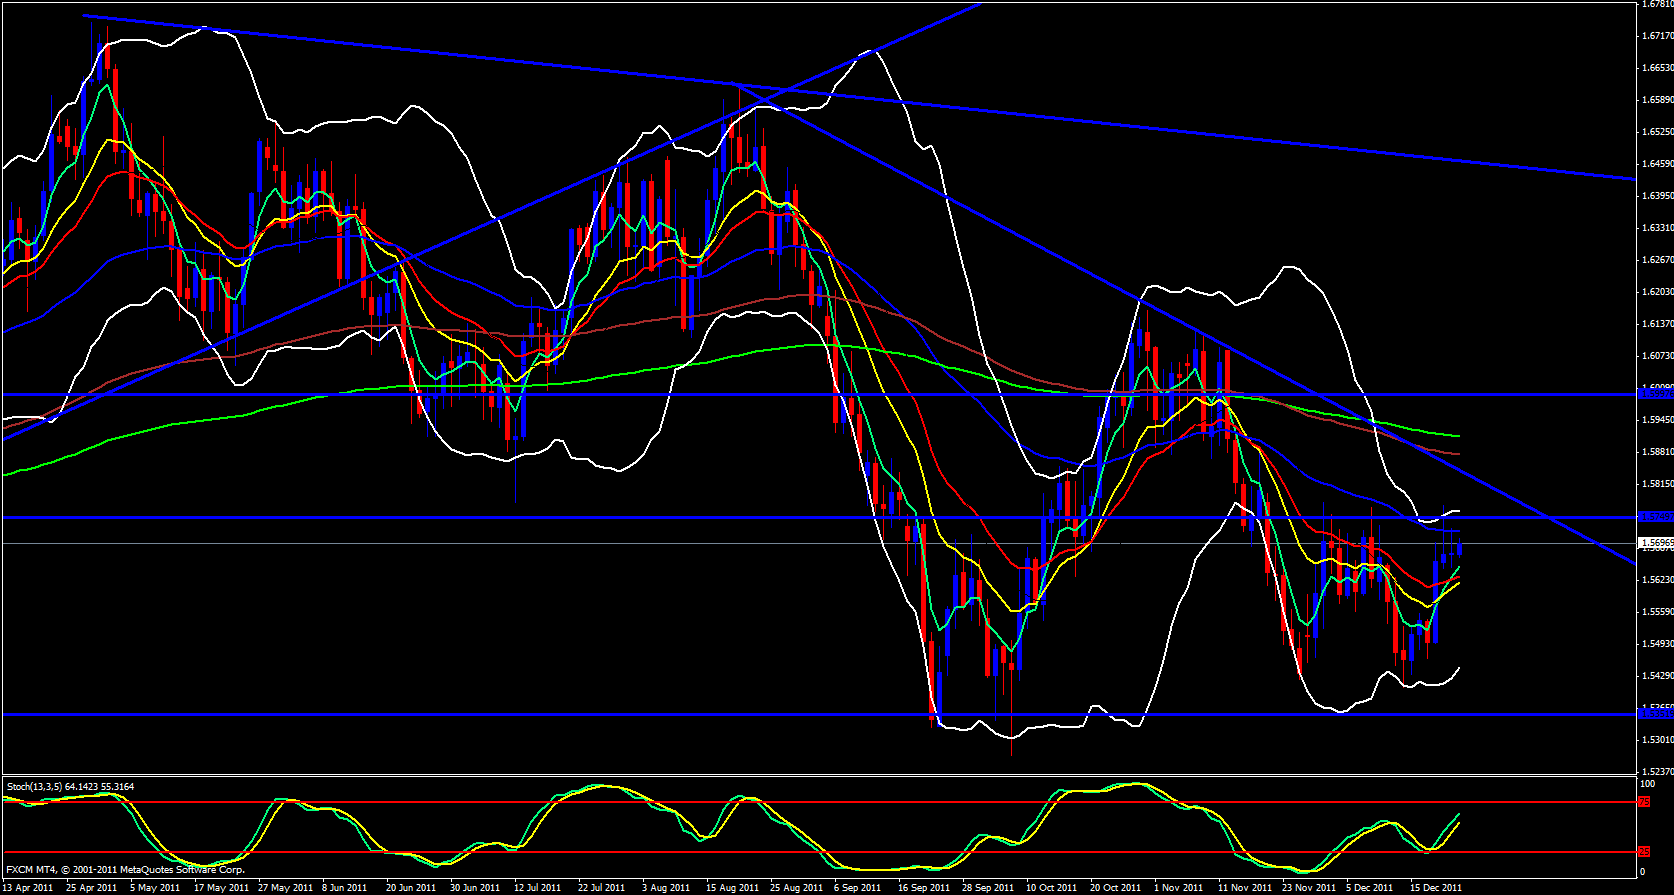
The 55 ema is a very powerful ema and is most effective especially on longer timeframes such as weekly and daily timeframes. Briefly, I just want to point out on the weekly timeframe price keeps touching visual resistance and gets rejected each time and this time the same level is being overlapped by the 13 ema. If price was rejected previously at that level of 1.5755 and was rejected without a 13 ema in that zone then most likely I expect price to be rejected again especially with a 13 ema overlapping.
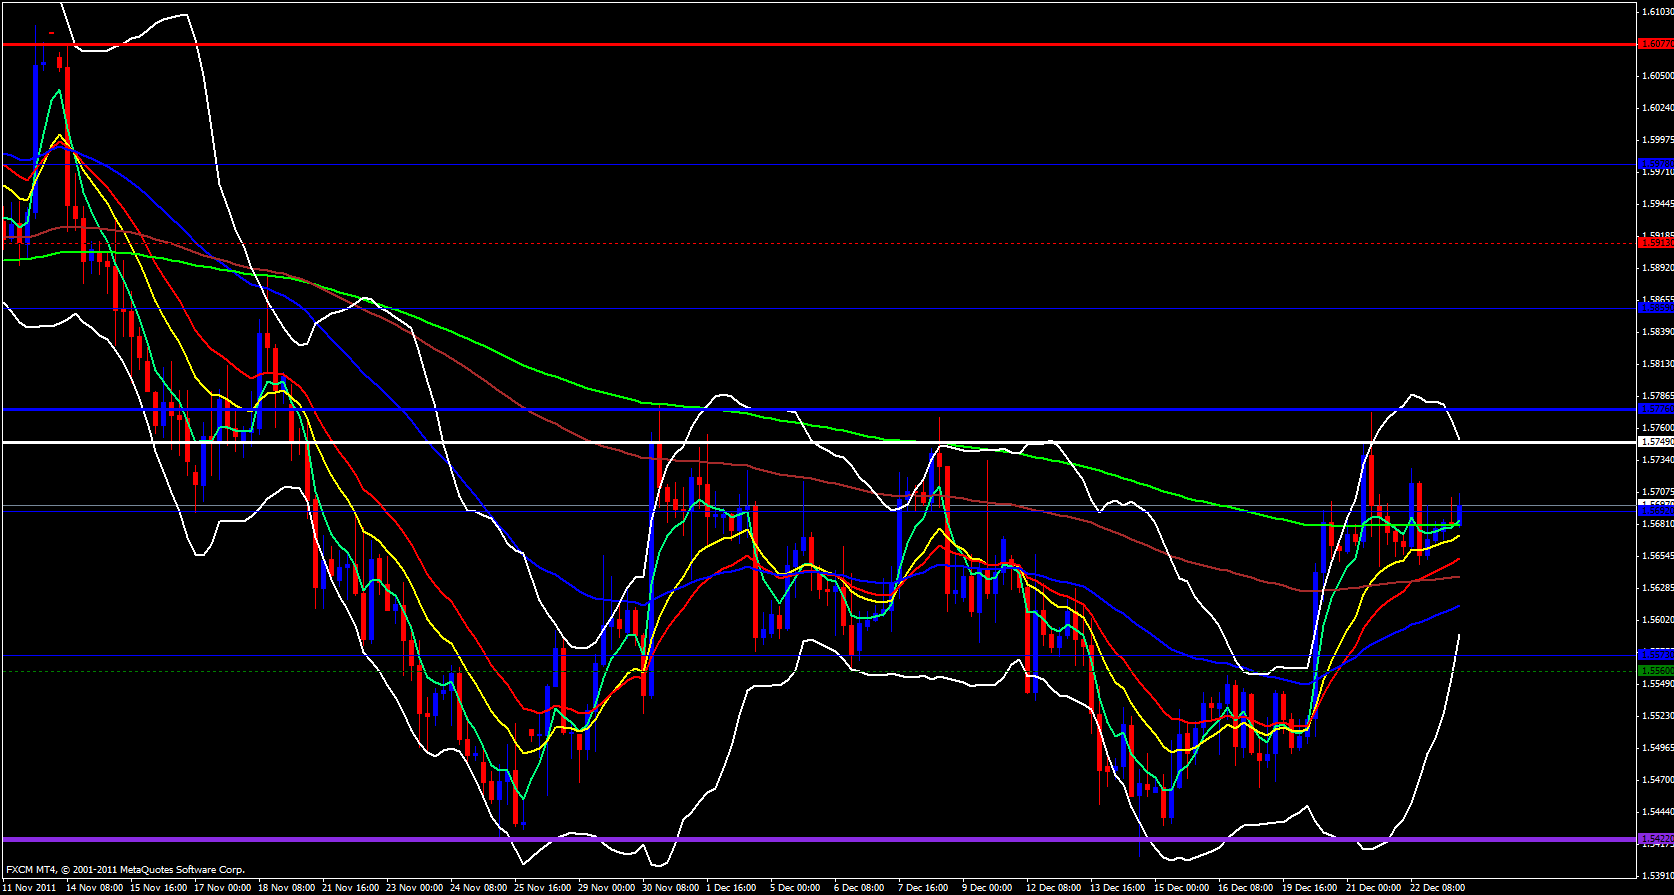
On the 4 hour timeframe price has made a couple lower highs and at a fib zone of the last major move to the downside. The upper Bollinger band is pointing down and overlapped by the weekly central pivot point, however, price has made its way above the 233 ema and the 5 ema is crossing above the 233 ema.
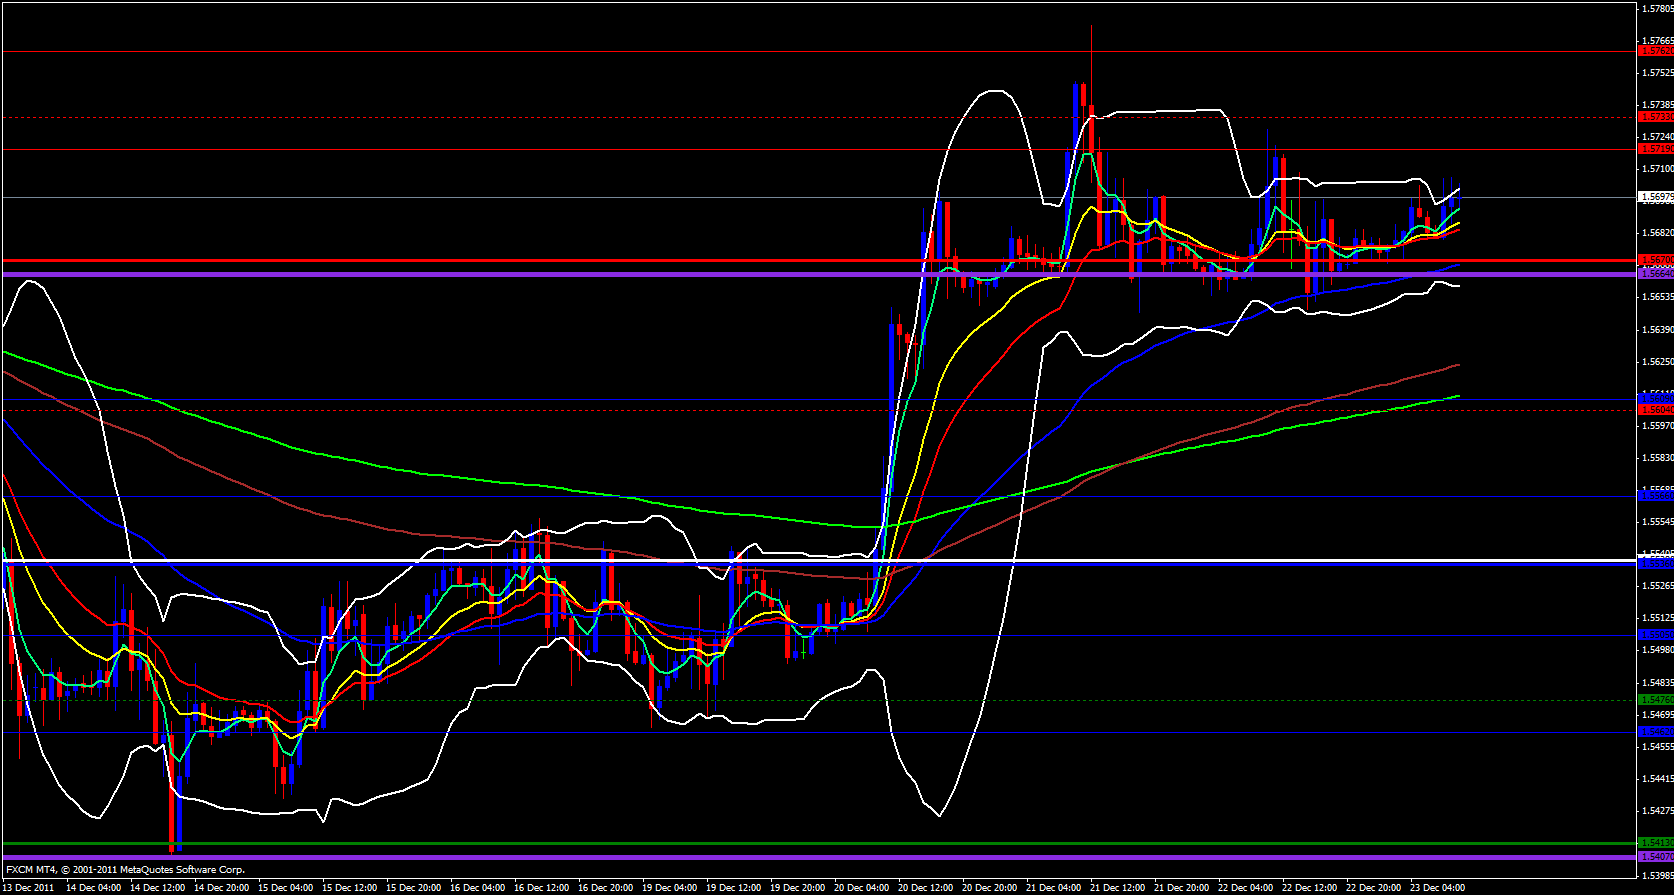
On the hourly timeframe prices has made a couple lower highs, however, the upper Bollinger band is opening up and beginning to point upwards. Price is just above the 5 ema, however, the weekly M4 ema is just 35 pips above and since it is a reversal pivot and it is the end of the week I would consider shorting if price reaches that level.
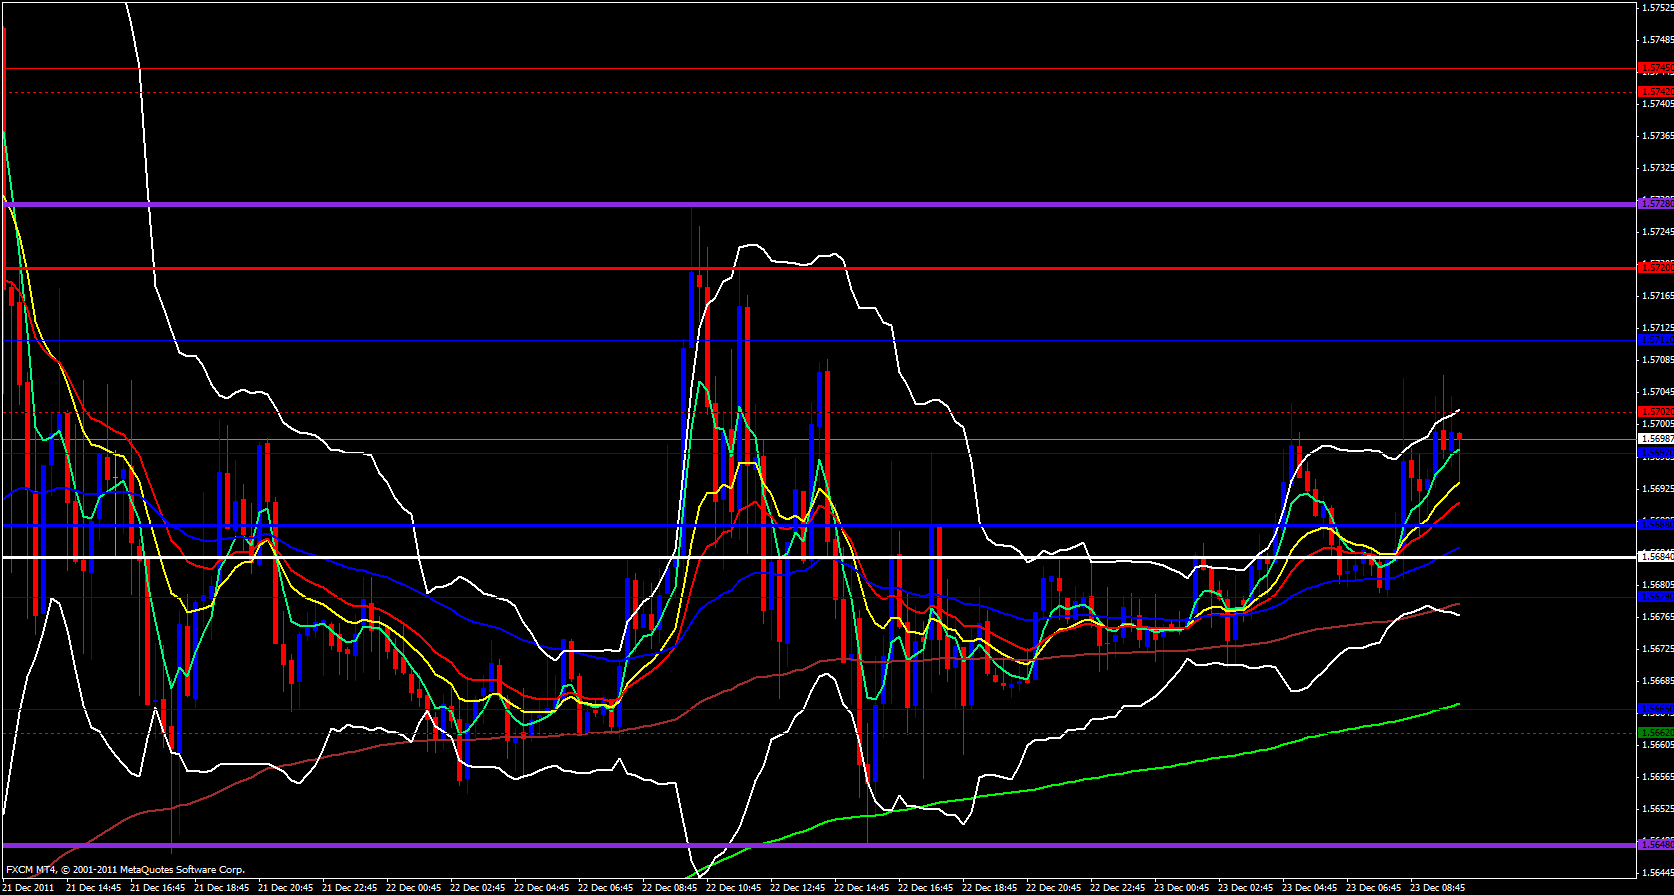
On the 15 minute timeframe price appears to be slowly rising, however, the daily R2 pivot is at 1.5720 and currently price is struggling to break the daily M3 pivot. If price breaks 1.5730 I expect it to head up to at least 1.5765, however, if it drops below 1.5680 I expect it to fall to 1.5640 I don't expect any major price action today since it is the last day of the trading week and the Christmas weekend.
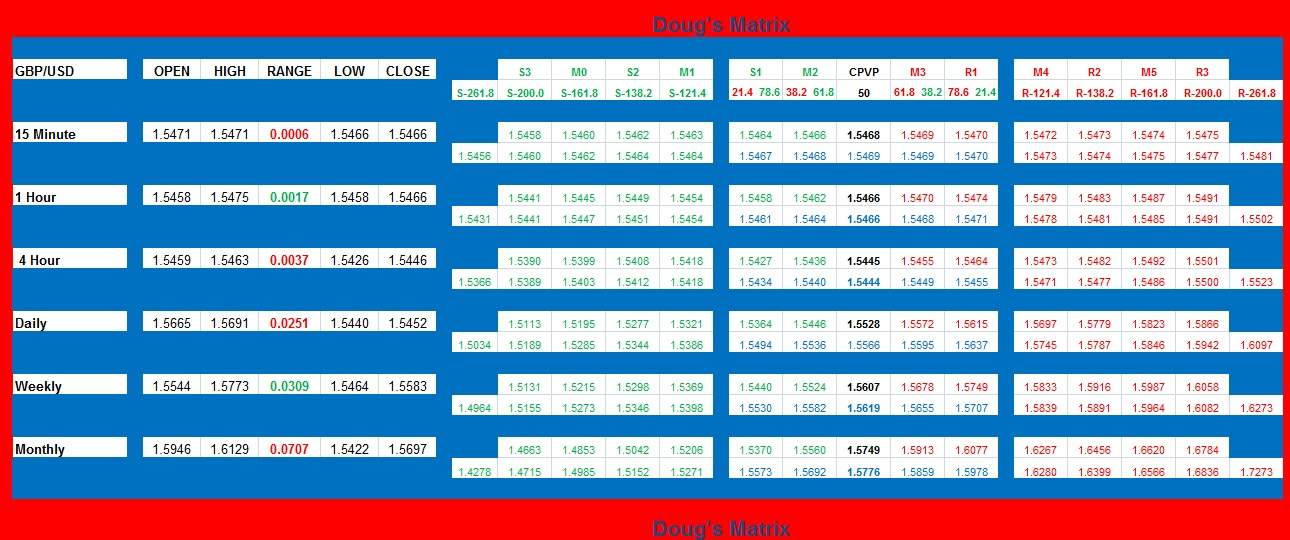
Included in my analysis is my custom made Support & Resistance Matrix which points out the various levels of support and resistance over multiple timeframes mathematically based on Pivot Point and Fibonacci theory so keep an eye on those price levels prior to entering any positions. It may save you from entering longs at resistance or entering shorts at support.


